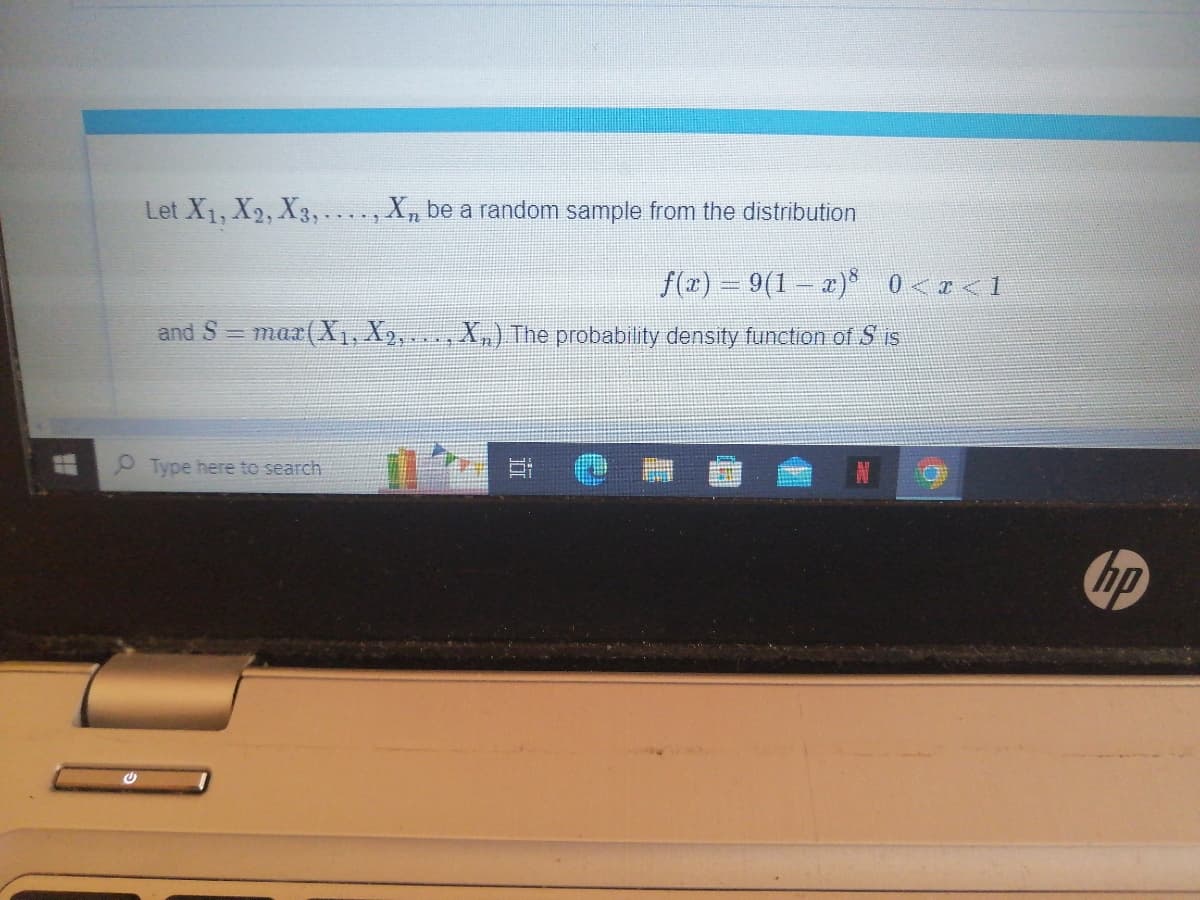
Let X1, X2, X3, ...., X₁ be a random sample from the distribution ƒ(x) = 9(1 − x)³ 0


Q: In a poll of 100 randomly selected students showed that 50% of the respondents believe in global…
A: Answer: From the given data, Sample size (n) = 100 Sample proportion (p∧) = 0.50 Confidence level =…
Q: What is Inferential Statistics?
A: Introduction Statistics is a field which involves collection, arrangement and analysis of data to…
Q: We want to estimate the proportion of individuals in a population who are in favor of a certain bill…
A: Given that the margin of error is, ME=0.04
Q: ) What will the price per month be in 2015 based on the company’s model? The consumer advocate’s…
A:
Q: The waiting line at a popular bakery shop can be quite long. Suppose that the waiting time in…
A:
Q: explain history of Marshall olkin transformation only why they develop and when it is first use and…
A: The Marshall-Olkin transformation is method to deal with the skewed data modelling or the data which…
Q: In an evaluation of a new classification algorithm, a sample of 1200 images randomly extracted from…
A: Given Information: Sample size n=1200 Of which, x=780 were classified correctly.
Q: a. Calculate the z-score for an SAT score of 720. Approximately how many students scored 720 or…
A:
Q: Question 20 In type I error, the significance level a is the probability of making the mistake of…
A: Given : In type I error, the significance level a is the probability of making the mistake of…
Q: In a test of h0 u=100 against ha :u>100 the sample data yielded the test statistic z=2.17 find and…
A: Given that Null and alternative hypothesis is. H0 : μ =100 Ha : μ >100 Test statistic z =2.17
Q: The distribution of blood types for 100 Americans is listed in the table. If one donor is selected…
A: Given that Total number of 100 Americans. We have to find probability of AB-
Q: Two samples are taken with the following numbers of successes and sample sizes X1 38 x2 = 21 n₁ = 73…
A: Given that n1=73, n2=85
Q: A real estate agency is interested in studying the relationship between the number of bedrooms in a…
A: Hi! Thank you for the question. As per the honor code, we are allowed to answer three sub-parts at a…
Q: Suppose there are many students like Judy (apply to 10 colleges, probability of acceptance is .4,…
A: Given that 10 colleges, probability of acceptance is 0.4 and number of acceptances is distributed…
Q: The table below provides the sales data for JD Inc. for the year 1998. Given: a = 0.2, ß = 0.15, and…
A: Given data: Sl. No. Month Values 1 Jan 3980 2 Feb 4000 3 Mar 4740 4 Apr 4720 5 May 4920…
Q: Listed below are diastolic blood pressure measurements (mm Hg) of females selected from Data Set 1…
A: The question is about outliers Given : To find : Identify the outliers from the data if any
Q: Assume you are a U.S. investor who is considering two options. Deposit $1,000 today in a U.S.…
A: The investor would choose to deposit $1,000 in the U.S. savings account. This is because the…
Q: The driver's reaction time in response to a particular potential traffic hazard is the time required…
A: Given data: 0.50, 0.49, 0.45, 0.54, 0.44, 0.49, 0.51, 0.48, 0.51, 0.53, 0.51, 0.63, 0.69, 0.76,…
Q: n an evaluation of a new classification algorithm, a sample of 1200 images randomly extracted from a…
A: Given Information: Sample size n=1200 Of which, x=780 were classified correctly.
Q: Listed below are pulse rates (beats per minute) from samples of adult males and females. Does there…
A: To know the stability of data, the appropriate measure is coefficient of variation. From this…
Q: A study of 1000 randomly selected flights of a major airline showed that 798 of the flights arrived…
A: Given that A study of 1000 randomly selected flights of a major airline showed that 798 of the…
Q: Using the data below, what is the simple exponential smoothing forecast for the 3rd week where…
A: Hi! Thank you for the question. As per the honor code, we are allowed to answer 1 question at a…
Q: What is the probability that a random sample of 50 birds from this population will include less than…
A: Solution:
Q: 7. A fish hatchery raises fish that weigh 7 pounds on average after 32 weeks. The hatchery has built…
A: Statistical test of hypothesis is a method in which one test how reliable sample data with…
Q: a. the number of pairs of shoes you own b. the type of car you drive c. the distance from your home…
A: To determine the correct data type for the given sentences.
Q: be 2. Can it be concluded from these data that the population mean is more than four visits per…
A: Given that, Sample size (n) = 25 Sample mean (x¯) = 4.5 Population sd (σ) = 2 Population mean (μ) =…
Q: A business bus travels 25 miles at 25mph, 25 miles at 50 mph, and 25 miles at 75mph. Calculate the…
A: GivenA business bus travels 25 miles at25 mph,50 mph,75 mphsample size(n)=3
Q: It is known that the scores of an exam vary in a certain population with values according to a…
A:
Q: A home improvement company is interested in improving customer satisfaction rate from the 66%…
A:
Q: 1. Which of the below statements is false about real options? Can be valued using binominal model…
A: Given data : Which of the below statements is false about real options? Can be valued using…
Q: QUESTION 15 The table below shows the estimated blood type distribution of adults in UAE. Blood Type…
A: Given that Distribution table. Blood type A B AB O Percentage 0.248 0.229 0.044 a=?
Q: The sunshine list mid-level bureaucrat depicted has a commute from a suburban home to a midtown…
A: Please note that as per our guidelines if multiple sub-parts are there in a question we can answer…
Q: the ways to come back in 2n steps) (bonus) Show that -o (2)² = (²n). Use the previous results to…
A:
Q: Here are the summary statistics for three variables, and three histograms. Each of the variables (1,…
A: Given The data is as follows: Variable Mean Median Standard deviation 1 50 50 10 2 50 50 15…
Q: occurred most often? In how many classes were 2 students absent? How many times were no more than 2…
A: Answer:- Given ungrouped frequency table- Number of Absent Number of Classes 0 2 1 3 2 5…
Q: The following data are the maximum daily ozone concentrations from cities A and B. Create…
A: Given data: City A City B 74 72 89 72 91 84 76 81 87 97 93 78 93 88 96 90 55 74
Q: 1 3 w 2 In some board games, you move your marker a certain number of spaces based on the result of…
A: The notion of probability is a central concept in statistics. The classical definition of…
Q: Given two samples, A and B, with Pearson's correlation coefficient r = 0.7, and a significance level…
A: With a Pearson's correlation coefficient of 0.7 and a significance level of 0.05, we can reject the…
Q: The amount of time (minutes) a sample of students spent on online social media in a 4-hour window is…
A: As per the Bartleby guildlines we have to solve first three subparts and rest can be reposted.....…
Q: Histo Number of Students 20 15 10 12 25 30 Grade 21 35 a. How many class intervals were used in the…
A: Note: According to Bartleby guidelines expert solve only one question and maximum three subpart of…
Q: a. Fill in the following frequency table using the data. Dividend Yield Frequency 2.5 to 3.0 3.0 to…
A: Answer:- Here, given data is
Q: How does alpha levels and signifigance allow researchers to generalize the larger population from…
A: Hypothesis testing is used to determine whether the sample is taken from the population or not. It…
Q: Suppose you collect the following data set on wages (5 per hour) and cigarette smoking (number of…
A: The bias is the error that occurred in the data set. Bias is of two types, they can be…
Q: 14 11 15 9 17 12 15 8 12 10 18 14 12 10 8 10 8 15 11 5 Use the Credit Hour…
A: Given data is14,11,15,9,17,12,15,8,12,10,18,14,12,10,8,10,8,15,11,5Sample size(n)=20
Q: To answer item 17 to 23, use MS Excel data analysis Consider the following data set, in which a…
A: First enter the given data in Excel as shown below.
Q: If one of the pedestrian deaths is randomly selected, find the probability that the pedestrian was…
A: Answer:- Given table, Driver Intoxicated? Pedestrian Intoxicated? Yes No total Yes 59…
Q: A group of 40 students in a library was sampled and the type of laptop they were using was examined.…
A: a)From the given inforation we have, Laptop Type HP Lenovo Dell Microsoft Apple Total Frequency…
Q: (a) What are the mean and the variance of X? E(X) = 1 V(X) = i (b) Determine the probability that X…
A:
Q: The following data was collected from 1 bag of Hershey Kisses®. Each Kiss® was weighed in grams with…
A: 1. Let X be the number of kisses. X¯=4.768=AVERAGE(A1:A81), Excel functions=0.069=STDEV.S(A1:A81),…
Q: Start A = {2,4,5} B = {1, 2, 6, 7} BnA={Ex: 1, 2, 3 }
A:

Step by step
Solved in 2 steps with 2 images

- Let the random variable Y denote the time (in minutes) for which a customer is waiting for the beginning of a service station since its arrival and let X denote the time (minutes) until the service is completed since its arrival at the service station. Since both X and Y measure the time since the arrival of the customer at the service station, always Y<X is true. The joint probability density function for X and Y is given as follows: fxy(x,y)=c(x+y) for 0<x<2 and 0<y<x what is the value of c? what is the covariance of X and Y? what is the correlation of X and Y?Suppose the random variables X and Y have joint probability density function f(x,y) given by: (image)Find: P(X < Y) = fX|Y=y (x)Suppose that two-dimensional continuous random variable (X, Y) has joint probability density function given by f(x,y) = 24xy, x is less than equal to 1 and greater than equal to 0, y is less than equal to 1 and greater than equal to 0, x+y is less than equal to 1 and greater than equal to 0. Check that E(Y) = E[E(Y|X)] and V(Y) = E[V(Y|X)] + V[E(Y|X)].
- On a production line, parts are produced with a certain average size, but the exact size of each part varies due to the imprecision of the production process. Suppose that the difference between the size of the pieces produced (in millimeters) and the average size, which we will call production error, can be modeled as a continuous random variable X with a probability density function given by f(x) = 2, 5e^(-5|x|), for x E R (is in the image). Parts where the production error is less than -0.46 mm or greater than 0.46 mm should be discarded. Calculate (approximating to 4 decimal places): a) What is the proportion of parts that the company discards in its production process? b) What is the proportion of parts produced where the production error is positive? c) Knowing that for a given part the production error is positive, what is the probability of this part being discarded?Consider two random variables X and Y whose joint probability density function is given byf_X,Y (x, y) = c if x + y ≤ 1, x ≤ 1, and y ≤ 1,0 otherwise What is the value of c?Suppose that X, Y are jointly continuous with joint probability density function f( x, y){ xe^-x(1+y), ifx >0 and y >00, otherwise. (a) Find the marginal density functions of X and Y. (b) Calculate the expectation E[XY]. (c) Calculate the expectation EIX/(1+ Y )1. (e) Determine if the random variables X and Y in this exercise are independent.
- The life (in years) of a laptop battery has a probability density function defined by P(x)=12e−x/2P(x)=12e-x/2for x in [0,∞)[0,∞). Find the probability that a randomly selected laptop battery will last between 3 and 8 years?Find a value of k that will make f a probability density function on the indicated interval.ƒ(x) = kx; [1, 5]Suppose that the joint density function of the random variables X and Y is f(x,y)=k(1+2y), if 1<x<13 and 0<y<1, and f(x,y)=0, otherwise. Show that the marginal distribution of X is g(x)=c, if 1<x<13, and g(x)=0 otherwise. Enter the value of c. Hint: Of course, first, you need to find the value of k. Round your answer to a number with two decimal digits after the decimal point. For example if your answer is 1/40, which is equal to 0.025, then you should enter 0.03. (Do NOT use decimal comma; 0,03 would be wrong.)
- Suppose that X is a continuous random variable with a probability density function is given by f(x)= 25 when x is between -2 and 2, and f(x)=0 otherwise. a.)Find E(X2), where X is raised to the power 2 b.) Find Var(2X+2)Let the continuous random variable X denote the current measured in a thin copper wire in milliamperes. Assume that the range of X is [4.9, 5.1] mA, and assume that the probability density function of X is f(x) = 5 for 4.9 <= x <= 5.1. What is the variance?Let X be a continuous random variable with density functionf(x) = 3x^-4, x ≥ 1. Compute E(X ) and Var(X ).


