Let's examine the mean of the numbers 1, 2, 3, 4, 5, 6, 7, and 8 by drawing samples from these values, calculating the mean of each sample, and then considering the sampling distribution of the mean. To do this, suppose you perform an experiment in which you roll an eight-sided die two times (or equivalently, roll two eight-sided dice one time) and calculate the mean of your sample. Remember that your population is the numbers 1, 2, 3, 4, 5, 6, 7, and 8. The true mean (u) of the numbers 1, 2, 3, 4, 5, 6, 7, and 8 is The number of possible different samples (each of size n = 2) is the number of possibilities on the first roll (8) times the number of possibilities on the second roll (also 8), or 8(8) = 64. If you collected all of these possible samples, the mean of your sampling distribution of means (UM) would equal and the standard deviation of your sampling distribution of means (that is, the standard error or GM) would be The following chart shows the sampling distribution of the mean (M) for your experiment. Suppose you do this experiment once (that is, you roll the die two times). Use the chart to determine the probability that the mean of your two rolls is equal to the true mean, or P(M = µ), is_ The probability that the mean of your two rolls is greater than 1.5, or P(M > 1.5), is Frequency 8 2 and the true standard deviation (c) is 1 1.0 1.5 2.0 2.5 3.0 3.5 4.0 4.5 50 M 5.5 60 6.5 7.0 7.5 8.0
Let's examine the mean of the numbers 1, 2, 3, 4, 5, 6, 7, and 8 by drawing samples from these values, calculating the mean of each sample, and then considering the sampling distribution of the mean. To do this, suppose you perform an experiment in which you roll an eight-sided die two times (or equivalently, roll two eight-sided dice one time) and calculate the mean of your sample. Remember that your population is the numbers 1, 2, 3, 4, 5, 6, 7, and 8. The true mean (u) of the numbers 1, 2, 3, 4, 5, 6, 7, and 8 is The number of possible different samples (each of size n = 2) is the number of possibilities on the first roll (8) times the number of possibilities on the second roll (also 8), or 8(8) = 64. If you collected all of these possible samples, the mean of your sampling distribution of means (UM) would equal and the standard deviation of your sampling distribution of means (that is, the standard error or GM) would be The following chart shows the sampling distribution of the mean (M) for your experiment. Suppose you do this experiment once (that is, you roll the die two times). Use the chart to determine the probability that the mean of your two rolls is equal to the true mean, or P(M = µ), is_ The probability that the mean of your two rolls is greater than 1.5, or P(M > 1.5), is Frequency 8 2 and the true standard deviation (c) is 1 1.0 1.5 2.0 2.5 3.0 3.5 4.0 4.5 50 M 5.5 60 6.5 7.0 7.5 8.0

Glencoe Algebra 1, Student Edition, 9780079039897, 0079039898, 2018
18th Edition
ISBN:9780079039897
Author:Carter
Publisher:Carter
Chapter10: Statistics
Section10.4: Distributions Of Data
Problem 19PFA

Related questions
Question
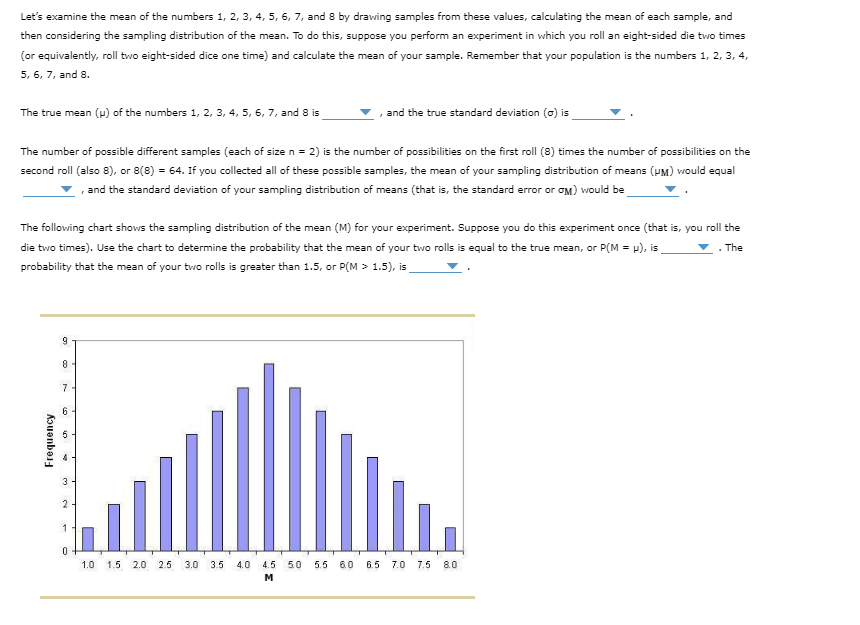
Transcribed Image Text:Let's examine the mean of the numbers 1, 2, 3, 4, 5, 6, 7, and 8 by drawing samples from these values, calculating the mean of each sample, and
then considering the sampling distribution of the mean. To do this, suppose you perform an experiment in which you roll an eight-sided die two times
(or equivalently, roll two eight-sided dice one time) and calculate the mean of your sample. Remember that your population is the numbers 1, 2, 3, 4,
5, 6, 7, and 8.
The true mean (p) of the numbers 1, 2, 3, 4, 5, 6, 7, and 8 is
The number of possible different samples (each of size n = 2) is the number of possibilities on the first roll (8) times the number of possibilities on the
second roll (also 8), or 8(8) = 64. If you collected all of these possible samples, the mean of your sampling distribution of means (HM) would equal
, and the standard deviation of your sampling distribution of means (that is, the standard error or GM) would be
The following chart shows the sampling distribution of the mean (M) for your experiment. Suppose you do this experiment once (that is, you roll the
die two times). Use the chart to determine the probability that the mean of your two rolls is equal to the true mean, or P(M = μ), is
▼. The
probability that the mean of your two rolls is greater than 1.5, or P(M > 1.5), is
Frequency
9
8
7
6
5
K
3
2
1
0
, and the true standard deviation (o) is
35
1.0 1.5 2.0 2.5 3.0 3.5 4.0 4.5 5.0 5.5 6.0 6.5
M
7.0 7.5 8.0
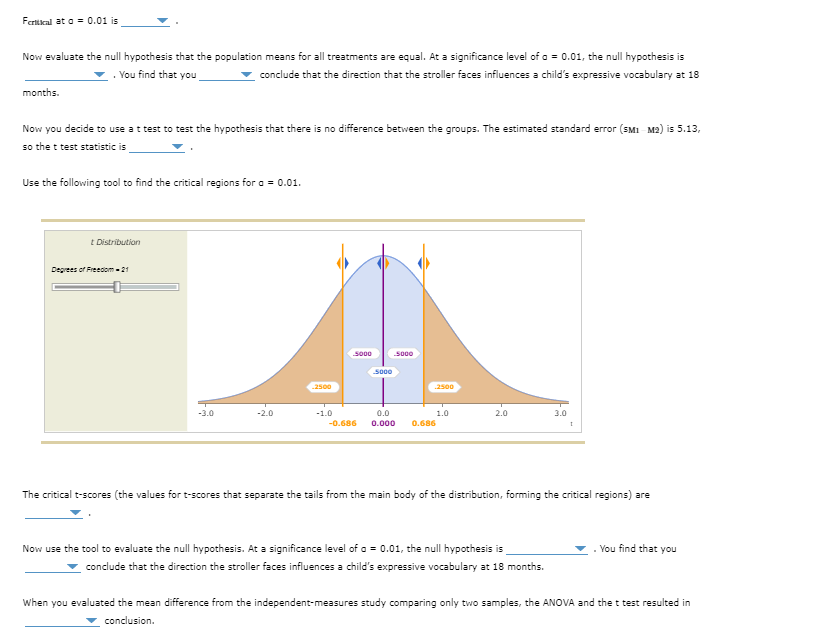
Transcribed Image Text:Fertical at a = 0.01 is
Now evaluate the null hypothesis that the population means for all treatments are equal. At a significance level of a = 0.01, the null hypothesis is
You find that you
conclude that the direction that the stroller faces influences a child's expressive vocabulary at 18
months.
Now you decide to use a t test to test the hypothesis that there is no difference between the groups. The estimated standard error (SM1 M2) is 5.13,
so the t test statistic is
Use the following tool to find the critical regions for a = 0.01.
t Distribution
Degrees of Freedom - 21
-3.0
-2.0
2500
-1.0
5000
5000
5000
0.0
-0.686 0.000 0.686
2500
1.0
2.0
3.0
Now use the tool to evaluate the null hypothesis. At a significance level of a = 0.01, the null hypothesis is
conclude that the direction the stroller faces influences a child's expressive vocabulary at 18 months.
1
The critical t-scores (the values for t-scores that separate the tails from the main body of the distribution, forming the critical regions) are
You find that you
When you evaluated the mean difference from the independent-measures study comparing only two samples, the ANOVA and the t test resulted in
conclusion.
Expert Solution
This question has been solved!
Explore an expertly crafted, step-by-step solution for a thorough understanding of key concepts.

This is a popular solution!

Trending now
This is a popular solution!

Step by step
Solved in 3 steps

Recommended textbooks for you
Glencoe Algebra 1, Student Edition, 9780079039897…
Algebra
ISBN:
9780079039897
Author:
Carter
Publisher:
McGraw Hill

Holt Mcdougal Larson Pre-algebra: Student Edition…
Algebra
ISBN:
9780547587776
Author:
HOLT MCDOUGAL
Publisher:
HOLT MCDOUGAL

College Algebra (MindTap Course List)
Algebra
ISBN:
9781305652231
Author:
R. David Gustafson, Jeff Hughes
Publisher:
Cengage Learning
Glencoe Algebra 1, Student Edition, 9780079039897…
Algebra
ISBN:
9780079039897
Author:
Carter
Publisher:
McGraw Hill
Holt Mcdougal Larson Pre-algebra: Student Edition…
Algebra
ISBN:
9780547587776
Author:
HOLT MCDOUGAL
Publisher:
HOLT MCDOUGAL
College Algebra (MindTap Course List)
Algebra
ISBN:
9781305652231
Author:
R. David Gustafson, Jeff Hughes
Publisher:
Cengage Learning