Liabilities & Stockholders Equity Accounts payable Notes Payable Аccruals 57, 000 49, 000 13, 000 5, 000 75, 000 150, 000 16, 000 6, 000 71, 000 160, 000 Total Current Liabilities Long Term Debt Shareholders Equity Com. stock Equity (share outstanding) Retained Earnings 110, 200 73, 100 183, 300 408, 300 120, 000 50, 200 170, 200 401, 200 Shareholders Equity Total Liabilities & S/holders Equity Calculate the following ratio for both years and comment on the comparison (use 365days) ; i. Current ratio ii. Acid ratio iii. Inventory turnover
Liabilities & Stockholders Equity Accounts payable Notes Payable Аccruals 57, 000 49, 000 13, 000 5, 000 75, 000 150, 000 16, 000 6, 000 71, 000 160, 000 Total Current Liabilities Long Term Debt Shareholders Equity Com. stock Equity (share outstanding) Retained Earnings 110, 200 73, 100 183, 300 408, 300 120, 000 50, 200 170, 200 401, 200 Shareholders Equity Total Liabilities & S/holders Equity Calculate the following ratio for both years and comment on the comparison (use 365days) ; i. Current ratio ii. Acid ratio iii. Inventory turnover

Fundamentals of Financial Management (MindTap Course List)
15th Edition
ISBN:9781337395250
Author:Eugene F. Brigham, Joel F. Houston
Publisher:Eugene F. Brigham, Joel F. Houston
Chapter4: Analysis Of Financial Statements
Section: Chapter Questions
Problem 24P: Income Statement for Year Ended December 31, 2018 (Millions of Dollars) Net sales 795.0 Cost of...

Related questions

Question
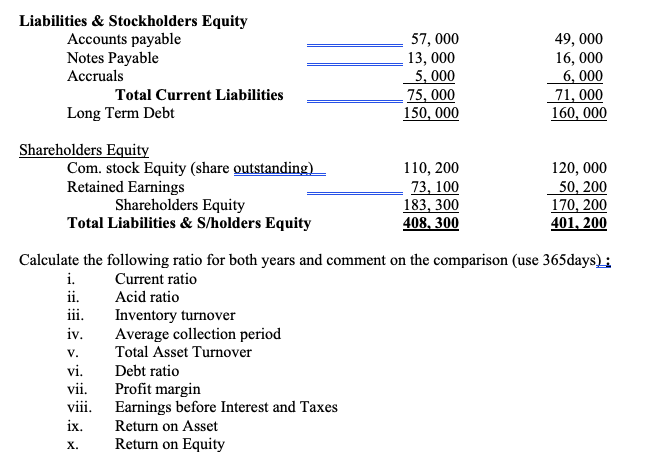
Transcribed Image Text:Liabilities & Stockholders Equity
Accounts payable
Notes Payable
Accruals
57, 000
13, 000
5, 000
75, 000
150, 000
49, 000
16, 000
6, 000
71, 000
160, 000
Total Current Liabilities
Long Term Debt
Shareholders Equity
Com. stock Equity (share outstanding)
Retained Earnings
110, 200
73, 100
183, 300
408, 300
120, 000
50, 200
170, 200
401, 200
Shareholders Equity
Total Liabilities & S/holders Equity
Calculate the following ratio for both years and comment on the comparison (use 365days) ;
i.
Current ratio
Acid ratio
Inventory turnover
Average collection period
Total Asset Turnover
ii.
ii.
iv.
V.
vi.
Debt ratio
Profit margin
viii. Earnings before Interest and Taxes
vii.
ix.
Return on Asset
х.
Return on Equity
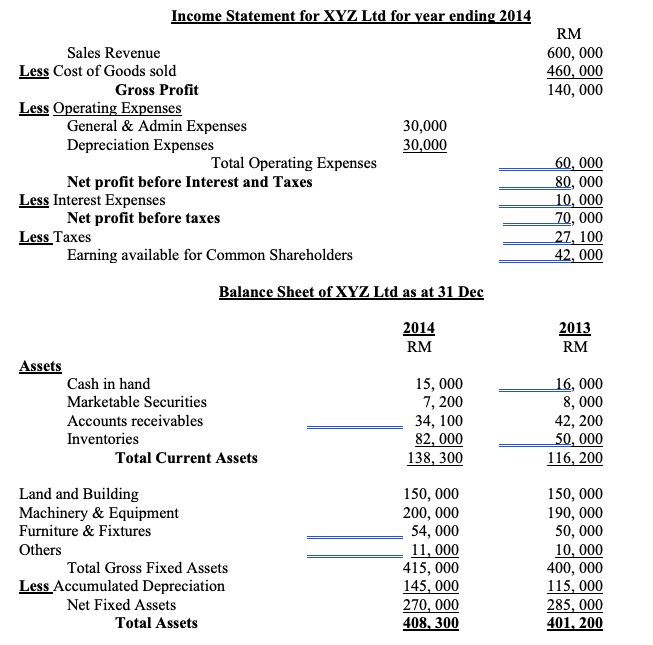
Transcribed Image Text:Income Statement for XYZ Ltd for year ending 2014
RM
Sales Revenue
600, 000
460, 000
140, 000
Less Cost of Goods sold
Gross Profit
Less Operating Expenses
General & Admin Expenses
Depreciation Expenses
30,000
30,000
60, 000
80, 000
10, 000
70, 000
27, 100
42, 000
Total Operating Expenses
Net profit before Interest and Taxes
Less Interest Expenses
Net profit before taxes
Less Taxes
Earning available for Common Shareholders
Balance Sheet of XYZ Ltd as at 31 Dec
2014
2013
RM
RM
Assets
15, 000
7, 200
34, 100
82, 000
138, 300
16, 000
8, 000
42, 200
50, 000
116, 200
Cash in hand
Marketable Securities
Accounts receivables
Inventories
Total Current Assets
Land and Building
Machinery & Equipment
Furniture & Fixtures
150, 000
200, 000
54, 000
11, 000
415, 000
145, 000
270, 000
408, 300
150, 000
190, 000
50, 000
10, 000
400, 000
115, 000
285, 000
401, 200
Others
Total Gross Fixed Assets
Less Accumulated Depreciation
Net Fixed Assets
Total Assets
Expert Solution
This question has been solved!
Explore an expertly crafted, step-by-step solution for a thorough understanding of key concepts.

This is a popular solution!

Trending now
This is a popular solution!

Step by step
Solved in 4 steps

Knowledge Booster


Learn more about
Need a deep-dive on the concept behind this application? Look no further. Learn more about this topic, accounting and related others by exploring similar questions and additional content below.Recommended textbooks for you
Fundamentals of Financial Management (MindTap Cou…
Finance
ISBN:
9781337395250
Author:
Eugene F. Brigham, Joel F. Houston
Publisher:
Cengage Learning

Cornerstones of Financial Accounting
Accounting
ISBN:
9781337690881
Author:
Jay Rich, Jeff Jones
Publisher:
Cengage Learning

Managerial Accounting: The Cornerstone of Busines…
Accounting
ISBN:
9781337115773
Author:
Maryanne M. Mowen, Don R. Hansen, Dan L. Heitger
Publisher:
Cengage Learning
Fundamentals of Financial Management (MindTap Cou…
Finance
ISBN:
9781337395250
Author:
Eugene F. Brigham, Joel F. Houston
Publisher:
Cengage Learning
Cornerstones of Financial Accounting
Accounting
ISBN:
9781337690881
Author:
Jay Rich, Jeff Jones
Publisher:
Cengage Learning
Managerial Accounting: The Cornerstone of Busines…
Accounting
ISBN:
9781337115773
Author:
Maryanne M. Mowen, Don R. Hansen, Dan L. Heitger
Publisher:
Cengage Learning

Financial Accounting: The Impact on Decision Make…
Accounting
ISBN:
9781305654174
Author:
Gary A. Porter, Curtis L. Norton
Publisher:
Cengage Learning

Survey of Accounting (Accounting I)
Accounting
ISBN:
9781305961883
Author:
Carl Warren
Publisher:
Cengage Learning

Intermediate Accounting: Reporting And Analysis
Accounting
ISBN:
9781337788281
Author:
James M. Wahlen, Jefferson P. Jones, Donald Pagach
Publisher:
Cengage Learning