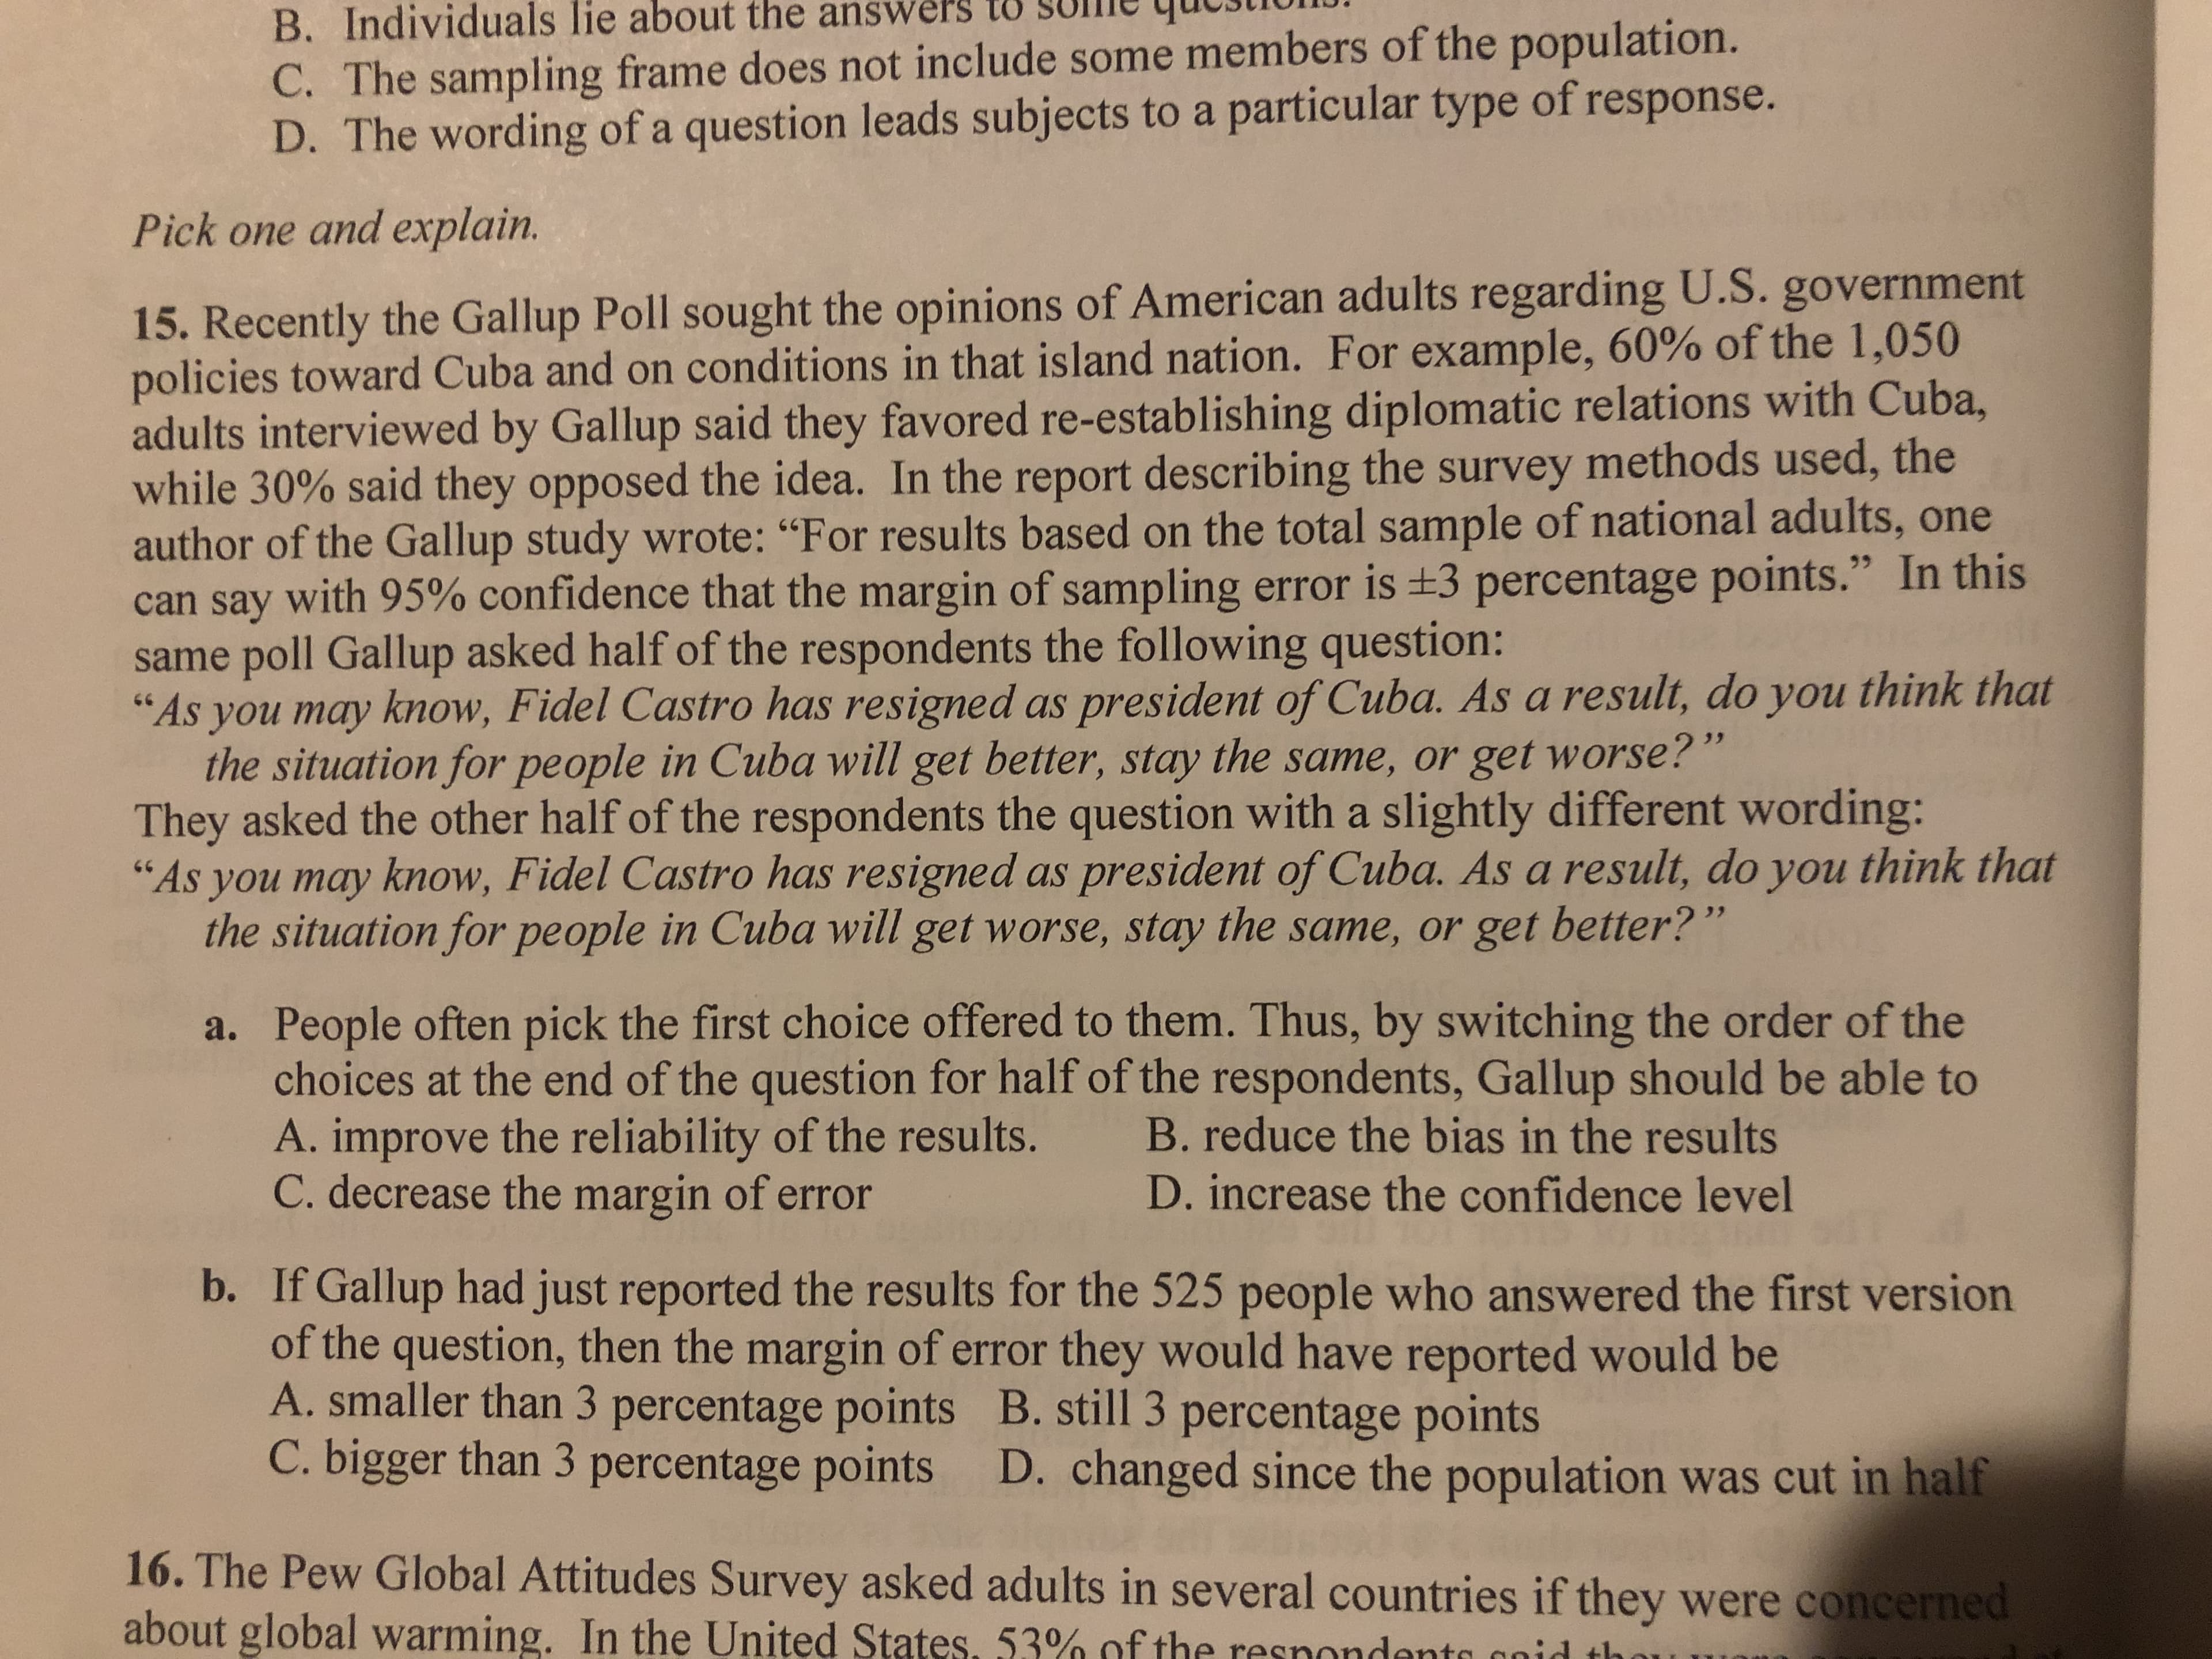
lie about the answers to SUlle quStIU B. Individuals C. The sampling frame does not include some members of the population. D. The wording of a question leads subjects to a particular type of response. Pick one and explain 5. Recently the Gallup Poll sought the opinions of American adults regarding U.S. government policies toward Cuba and on conditions in that island nation. For example, 60% of the 1,050 adults interviewed by Gallup said they favored re-establishing diplomatic relations with Cuba, while 30% author of the Gallup study wrote: "For results based on the total sample of national adults, one can say with 95% confidence that the margin of sampling error is 3 percentage points. same poll Gallup asked half of the respondents the following question: As you may know, Fidel Castro has resigned as president of Cuba. As a result, do you think that ó said they opposed the idea. In the report describing the survey methods used, the " In this the situation for people in Cuba will get better, stay the same, or get worse They asked the other half of the respondents the question with a slightly different wording: As you may know, Fidel Castro has resigned as president of Cuba. As a result, do you think that the situation for people in Cuba will get worse, stay the same, or get better? a. People often pick the first choice offered to them. Thus, by switching the order of the choices at the end of the question for half of the respondents, Gallup should be able to A. improve the reliability of the results. C. decrease the margin of error B. reduce the bias in the results increase the confidence level b. If Gallup had just reported the results for the 525 people who answered the first version of the question, then the margin of error they would have reported would be A. smaller than 3 percentage points C. B. still 3 percentage points D. changed since the population was cut in h bigger than 3 percentage points 16. The Pew Global Attitudes Survey asked adults in several countries if they were about global warming. In the United States, 53% of the respondents said t!
lie about the answers to SUlle quStIU B. Individuals C. The sampling frame does not include some members of the population. D. The wording of a question leads subjects to a particular type of response. Pick one and explain 5. Recently the Gallup Poll sought the opinions of American adults regarding U.S. government policies toward Cuba and on conditions in that island nation. For example, 60% of the 1,050 adults interviewed by Gallup said they favored re-establishing diplomatic relations with Cuba, while 30% author of the Gallup study wrote: "For results based on the total sample of national adults, one can say with 95% confidence that the margin of sampling error is 3 percentage points. same poll Gallup asked half of the respondents the following question: As you may know, Fidel Castro has resigned as president of Cuba. As a result, do you think that ó said they opposed the idea. In the report describing the survey methods used, the " In this the situation for people in Cuba will get better, stay the same, or get worse They asked the other half of the respondents the question with a slightly different wording: As you may know, Fidel Castro has resigned as president of Cuba. As a result, do you think that the situation for people in Cuba will get worse, stay the same, or get better? a. People often pick the first choice offered to them. Thus, by switching the order of the choices at the end of the question for half of the respondents, Gallup should be able to A. improve the reliability of the results. C. decrease the margin of error B. reduce the bias in the results increase the confidence level b. If Gallup had just reported the results for the 525 people who answered the first version of the question, then the margin of error they would have reported would be A. smaller than 3 percentage points C. B. still 3 percentage points D. changed since the population was cut in h bigger than 3 percentage points 16. The Pew Global Attitudes Survey asked adults in several countries if they were about global warming. In the United States, 53% of the respondents said t!

Holt Mcdougal Larson Pre-algebra: Student Edition 2012
1st Edition
ISBN:9780547587776
Author:HOLT MCDOUGAL
Publisher:HOLT MCDOUGAL
Chapter11: Data Analysis And Probability
Section11.4: Collecting Data
Problem 5E

Related questions
Question
Transcribed Image Text:lie
about
the
answers
to
SUlle
quStIU
B. Individuals
C. The sampling frame does not include some members of the population.
D. The wording of a question leads subjects to a particular type of response.
Pick one and explain
5. Recently the Gallup Poll sought the opinions of American adults regarding U.S. government
policies toward Cuba and on conditions in that island nation. For example, 60% of the 1,050
adults interviewed by Gallup said they favored re-establishing diplomatic relations with Cuba,
while 30%
author of the Gallup study wrote: "For results based on the total sample of national adults, one
can say with 95% confidence that the margin of sampling error is 3 percentage points.
same poll Gallup asked half of the respondents the following question:
As you may know, Fidel Castro has resigned as president of Cuba. As a result, do you think that
ó said they opposed the idea. In the report describing the survey methods used, the
" In this
the situation for people in Cuba will get better, stay the same, or get worse
They asked the other half of the respondents the question with a slightly different wording:
As you may know, Fidel Castro has resigned as president of Cuba. As a result, do you think that
the situation for people in Cuba will get worse, stay the same, or get better?
a. People often pick the first choice offered to them. Thus, by switching the order of the
choices at the end of the question for half of the respondents, Gallup should be able to
A. improve the reliability of the results.
C. decrease the margin of error
B. reduce the bias in the results
increase the confidence level
b. If Gallup had just reported the results for the 525 people who answered the first version
of the question, then the margin of error they would have reported would be
A. smaller than 3 percentage points
C.
B. still 3 percentage points
D. changed since the population was cut in h
bigger than 3 percentage points
16. The Pew Global Attitudes Survey asked adults in several countries if they were
about global warming. In the United States, 53% of the respondents said t!
Expert Solution
This question has been solved!
Explore an expertly crafted, step-by-step solution for a thorough understanding of key concepts.

This is a popular solution!

Trending now
This is a popular solution!

Step by step
Solved in 2 steps with 1 images

Recommended textbooks for you
Holt Mcdougal Larson Pre-algebra: Student Edition…
Algebra
ISBN:
9780547587776
Author:
HOLT MCDOUGAL
Publisher:
HOLT MCDOUGAL

College Algebra (MindTap Course List)
Algebra
ISBN:
9781305652231
Author:
R. David Gustafson, Jeff Hughes
Publisher:
Cengage Learning

Glencoe Algebra 1, Student Edition, 9780079039897…
Algebra
ISBN:
9780079039897
Author:
Carter
Publisher:
McGraw Hill
Holt Mcdougal Larson Pre-algebra: Student Edition…
Algebra
ISBN:
9780547587776
Author:
HOLT MCDOUGAL
Publisher:
HOLT MCDOUGAL
College Algebra (MindTap Course List)
Algebra
ISBN:
9781305652231
Author:
R. David Gustafson, Jeff Hughes
Publisher:
Cengage Learning
Glencoe Algebra 1, Student Edition, 9780079039897…
Algebra
ISBN:
9780079039897
Author:
Carter
Publisher:
McGraw Hill