Lillian conducted a small survey of her friends and family. She asked them how many hours per week they spend reading digital documents (newspapers, blogs, books, etc.), and their age. She created the scatter plot below with the results she obtained. Draw the regression line that best represents this scatter plot and determine its equation.
Lillian conducted a small survey of her friends and family. She asked them how many hours per week they spend reading digital documents (newspapers, blogs, books, etc.), and their age. She created the scatter plot below with the results she obtained. Draw the regression line that best represents this scatter plot and determine its equation.

Algebra & Trigonometry with Analytic Geometry
13th Edition
ISBN:9781133382119
Author:Swokowski
Publisher:Swokowski
Chapter4: Polynomial And Rational Functions
Section4.6: Variation
Problem 37E

Related questions
Question
Lillian conducted a small survey of her friends and family. She asked them how many hours per week they spend reading digital documents (newspapers, blogs, books, etc.), and their age. She created the scatter plot below with the results she obtained.
Draw the regression line that best represents this scatter plot and determine its equation.
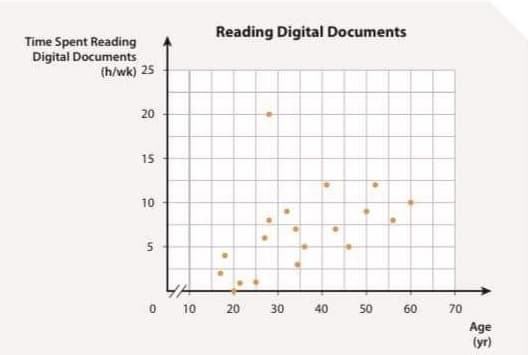
Transcribed Image Text:Reading Digital Documents
Time Spent Reading
Digital Documents
(h/wk) 25
20
15
10
10
20
30
40
50
60
70
Age
(yr)
Expert Solution
This question has been solved!
Explore an expertly crafted, step-by-step solution for a thorough understanding of key concepts.

Step by step
Solved in 2 steps with 4 images

Recommended textbooks for you
Algebra & Trigonometry with Analytic Geometry
Algebra
ISBN:
9781133382119
Author:
Swokowski
Publisher:
Cengage

Big Ideas Math A Bridge To Success Algebra 1: Stu…
Algebra
ISBN:
9781680331141
Author:
HOUGHTON MIFFLIN HARCOURT
Publisher:
Houghton Mifflin Harcourt
Algebra & Trigonometry with Analytic Geometry
Algebra
ISBN:
9781133382119
Author:
Swokowski
Publisher:
Cengage
Big Ideas Math A Bridge To Success Algebra 1: Stu…
Algebra
ISBN:
9781680331141
Author:
HOUGHTON MIFFLIN HARCOURT
Publisher:
Houghton Mifflin Harcourt