Linearized the model below and use the data to find(u4, B4): 0.1 0.2 04 06 0.9 1.3 1.5 1.7 1.8 yl0.75 1.25 1.45 1.25 0.85 0.55 0.35 0.28 0.18
Linearized the model below and use the data to find(u4, B4): 0.1 0.2 04 06 0.9 1.3 1.5 1.7 1.8 yl0.75 1.25 1.45 1.25 0.85 0.55 0.35 0.28 0.18

Chapter4: Linear Functions
Section4.3: Fitting Linear Models To Data
Problem 3SE: What is extrapolation when using a linear model?

Related questions
Question
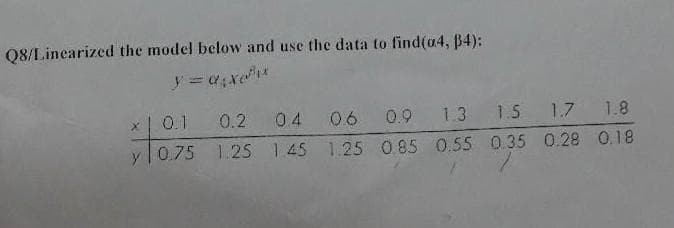
Transcribed Image Text:Q8/Linearized the model below and use the data to find(a4, B4):
0.1 0.2
04
06 0.9 1.3 15 1.7 1.8
0.75
1.25 145 1.25 0.85 0.55 0.35 0.28 0.18
Expert Solution
This question has been solved!
Explore an expertly crafted, step-by-step solution for a thorough understanding of key concepts.

Step by step
Solved in 6 steps

Recommended textbooks for you

Algebra & Trigonometry with Analytic Geometry
Algebra
ISBN:
9781133382119
Author:
Swokowski
Publisher:
Cengage

Glencoe Algebra 1, Student Edition, 9780079039897…
Algebra
ISBN:
9780079039897
Author:
Carter
Publisher:
McGraw Hill
Algebra & Trigonometry with Analytic Geometry
Algebra
ISBN:
9781133382119
Author:
Swokowski
Publisher:
Cengage
Glencoe Algebra 1, Student Edition, 9780079039897…
Algebra
ISBN:
9780079039897
Author:
Carter
Publisher:
McGraw Hill


Functions and Change: A Modeling Approach to Coll…
Algebra
ISBN:
9781337111348
Author:
Bruce Crauder, Benny Evans, Alan Noell
Publisher:
Cengage Learning