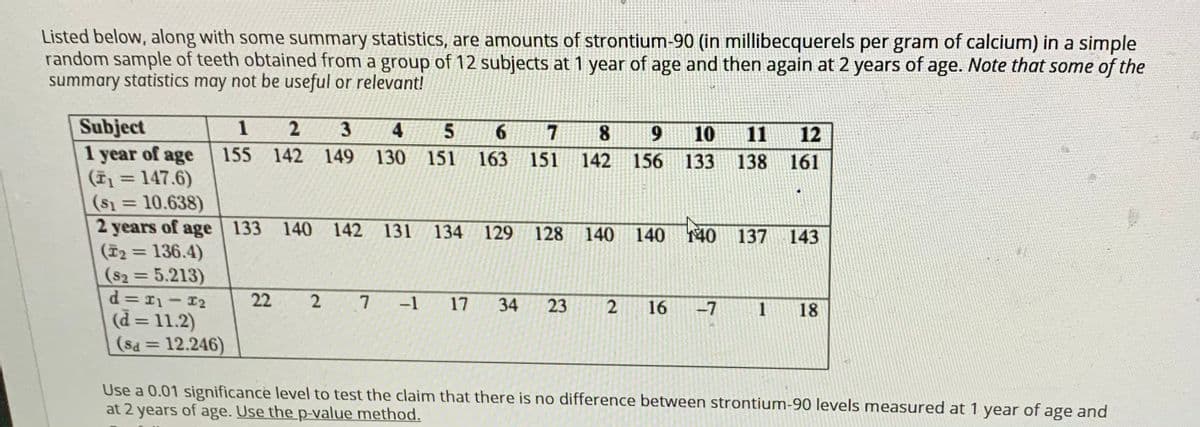
Listed below, along with some summary statistics, are amounts of strontium-90 (in millibecquerels per gram of calcium) in a simple random sample of teeth obtained from a group of 12 subjects at 1 year of age and then again at 2 years of age. Note that some of the summary statistics may not be useful or relevant! Subject 1 year of age (=147.6) (s1 = 10.638) 2 years of age (2 = 136.4) (82=5.213) 4 6. 8 10 11 12 155 142 149 130 151 163 151 142 156 133 138 161 133 140 142 131 134 129 128 140 140 40 137 143 22 -1 17 34 23 16 -7 1 18 (d = 11.2) (Sa 12.246) 7I - II = P Use a 0.01 significance level to test the claim that there is no difference between strontium-90 levels measured at 1 year of age and at 2 years of age. Use the p-value method.
Continuous Probability Distributions
Probability distributions are of two types, which are continuous probability distributions and discrete probability distributions. A continuous probability distribution contains an infinite number of values. For example, if time is infinite: you could count from 0 to a trillion seconds, billion seconds, so on indefinitely. A discrete probability distribution consists of only a countable set of possible values.
Normal Distribution
Suppose we had to design a bathroom weighing scale, how would we decide what should be the range of the weighing machine? Would we take the highest recorded human weight in history and use that as the upper limit for our weighing scale? This may not be a great idea as the sensitivity of the scale would get reduced if the range is too large. At the same time, if we keep the upper limit too low, it may not be usable for a large percentage of the population!
Include a diagram of the distribution indicating important components of the question

Step by step
Solved in 2 steps


