Listed below are foot lengths (mm) and heights (mm) of males. Find the regression equation, letting foot length be the predictor (x) variable. Find the best predicted height of a male with a foot length of 272.8 mm. How does the result compare to the actual height of 1776 mm? Foot Length Height 281.8 277.7 253.2 259.2 279.1 258.0 274.2 262.2 e 1784.7 1770.8 1676.3 1645.8 1858.9 1709.7 1789.3 1737.2 The regression equation is y = + )x. (Round the y-intercept to the nearest integer as needed. Round the slope to two decimal places as needed.) The best predicted height of a male with a foot length of 272.8 mm is mm. (Round to the nearest integer as needed.) How does the result compare to the actual height of 1776 mm? O A. The result is close to the actual height of 1776 mm. O B. The result is exactly the same as the actual height of 1776 mm. OC. The result is very different from the actual height of 1776 mm. OD. The result does not make sense given the context of the data.
Listed below are foot lengths (mm) and heights (mm) of males. Find the regression equation, letting foot length be the predictor (x) variable. Find the best predicted height of a male with a foot length of 272.8 mm. How does the result compare to the actual height of 1776 mm? Foot Length Height 281.8 277.7 253.2 259.2 279.1 258.0 274.2 262.2 e 1784.7 1770.8 1676.3 1645.8 1858.9 1709.7 1789.3 1737.2 The regression equation is y = + )x. (Round the y-intercept to the nearest integer as needed. Round the slope to two decimal places as needed.) The best predicted height of a male with a foot length of 272.8 mm is mm. (Round to the nearest integer as needed.) How does the result compare to the actual height of 1776 mm? O A. The result is close to the actual height of 1776 mm. O B. The result is exactly the same as the actual height of 1776 mm. OC. The result is very different from the actual height of 1776 mm. OD. The result does not make sense given the context of the data.

Chapter4: Linear Functions
Section: Chapter Questions
Problem 40RE: For the following exercises, consider the data in Table 5, which shows the percent of unemployed ina...

Related questions
Question
1.
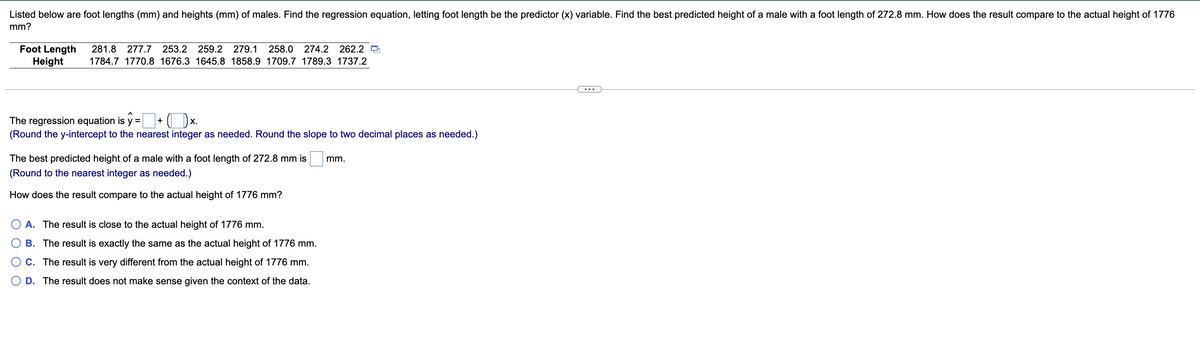
Transcribed Image Text:Listed below are foot lengths (mm) and heights (mm) of males. Find the regression equation, letting foot length be the predictor (x) variable. Find the best predicted height of a male with a foot length of 272.8 mm. How does the result compare to the actual height of 1776
mm?
Foot Length
281.8
277.7
253.2
259.2
279.1
258.0
274.2
262.2 D
Height
1784.7 1770.8 1676.3 1645.8 1858.9 1709.7 1789.3 1737.2
The regression equation is y = + ( )x.
(Round the y-intercept to the nearest integer as needed. Round the slope to two decimal places as needed.)
The best predicted height of a male with a foot length of 272.8 mm is
mm.
(Round to the nearest integer as needed.)
How does the result compare to the actual height of 1776 mm?
A. The result is close to the actual height of 1776 mm.
B. The result is exactly the same as the actual height of 1776 mm.
C. The result is very different from the actual height of 1776 mm.
D. The result does not make sense given the context of the data.
Expert Solution
This question has been solved!
Explore an expertly crafted, step-by-step solution for a thorough understanding of key concepts.

This is a popular solution!

Trending now
This is a popular solution!

Step by step
Solved in 4 steps

Recommended textbooks for you

Algebra and Trigonometry (MindTap Course List)
Algebra
ISBN:
9781305071742
Author:
James Stewart, Lothar Redlin, Saleem Watson
Publisher:
Cengage Learning

Glencoe Algebra 1, Student Edition, 9780079039897…
Algebra
ISBN:
9780079039897
Author:
Carter
Publisher:
McGraw Hill
Algebra and Trigonometry (MindTap Course List)
Algebra
ISBN:
9781305071742
Author:
James Stewart, Lothar Redlin, Saleem Watson
Publisher:
Cengage Learning
Glencoe Algebra 1, Student Edition, 9780079039897…
Algebra
ISBN:
9780079039897
Author:
Carter
Publisher:
McGraw Hill

Functions and Change: A Modeling Approach to Coll…
Algebra
ISBN:
9781337111348
Author:
Bruce Crauder, Benny Evans, Alan Noell
Publisher:
Cengage Learning

Big Ideas Math A Bridge To Success Algebra 1: Stu…
Algebra
ISBN:
9781680331141
Author:
HOUGHTON MIFFLIN HARCOURT
Publisher:
Houghton Mifflin Harcourt