Listed below are speeds (mi/h) measured from traffic on a busy highway. This simple random sample was obtained at 3:30 P.M. on a weekday. Use the sample data construct a 98% confidence interval estimate of the population standard deviation. 62 60 60 56 60 53 61 60 61 70 59 68 Click the icon to view the table of Chi-Square critical values. The confidence interval estimate is mi/h
Listed below are speeds (mi/h) measured from traffic on a busy highway. This simple random sample was obtained at 3:30 P.M. on a weekday. Use the sample data construct a 98% confidence interval estimate of the population standard deviation. 62 60 60 56 60 53 61 60 61 70 59 68 Click the icon to view the table of Chi-Square critical values. The confidence interval estimate is mi/h

MATLAB: An Introduction with Applications
6th Edition
ISBN:9781119256830
Author:Amos Gilat
Publisher:Amos Gilat
Chapter1: Starting With Matlab
Section: Chapter Questions
Problem 1P

Related questions

Question
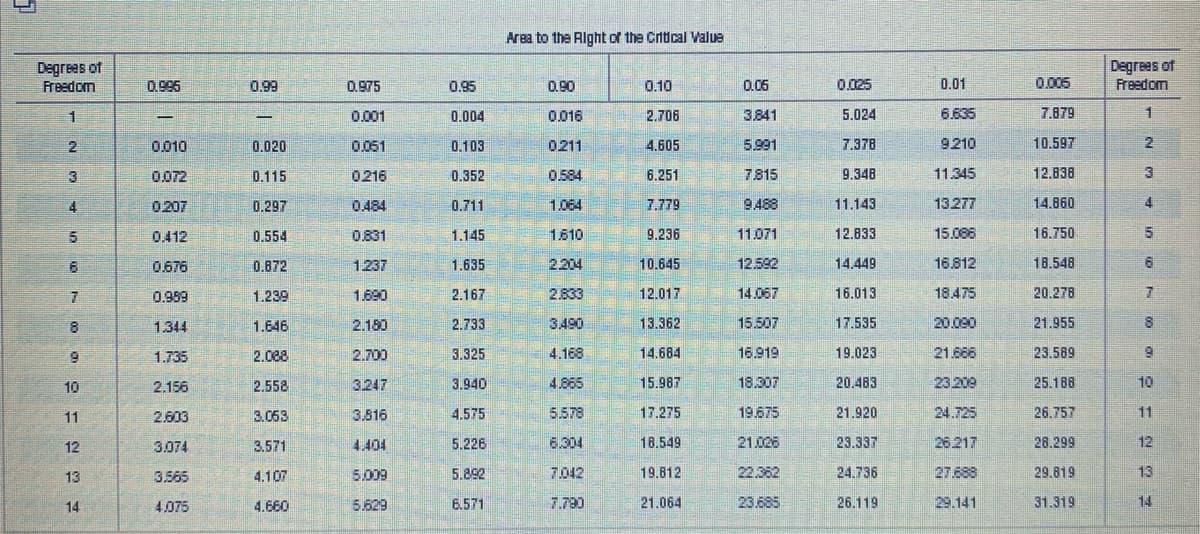
Transcribed Image Text:Area to the Aight of the Critical alue
Degrees of
Degrees of
Freedom
0.995
0.99
0.975
0.95
0.90
0.10
0.06
0.025
0.01
0.005
Freedom
0.001
0.004
0.016
2.706
3.841
5.024
6.635
7.879
2
0.010
0.020
0.051
0.103
0.211
4,605
5.991
7.378
9.210
10.597
0.072
0.115
0216
0.352
0.584
6.251
7.815
9.348
11.345
12.838
0207
0.297
0.484
0.711
1,064
7.779
9.488
11.143
13.277
14.860
4.
0.412
0.554
0.831
1.145
1.610
9.236
11.071
12.833
15.006
16.750
5
0.676
0.872
1237
1.635
2204
10.645
12.592
14.449
16.812
18.548
6.
0.999
1.239
1,690
2.167
2.833
12.017
14.067
16.013
18.475
20.278
1.344
1.646
2.180
2.733
3490
13.362
15.507
17.535
20.090
21.955
6.
1.735
2.088
2.700
3.325
4.168
14.684
16.919
19.023
21.686
23.589
10
2.156
2.558
3247
3.940
4.865
15.987
18.307
20.483
23.209
25.188
10
11
2.603
3.053
3.516
4.575
5.578
17.275
19.675
21.920
24.725
26.757
11
12
3.074
3.571
4.404
5.226
6.004
18,549
21.026
23.337
26.217
28.299
12
13
3.565
4.107
5.009
5.892
7042
19.812
22.362
24.736
27.688
29.819
13
14
4.075
4.660
5.629
Б.571
7.790
21.064
23.685
26.119
29.141
31.319
14
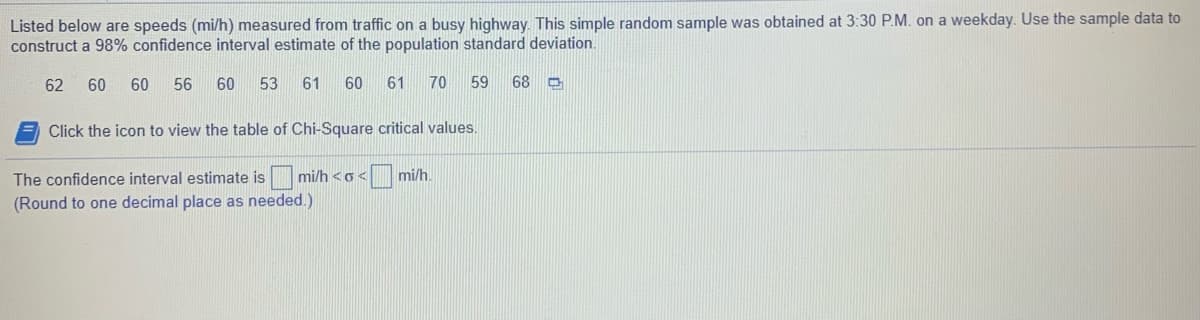
Transcribed Image Text:Listed below are speeds (mi/h) measured from traffic on a busy highway. This simple random sample was obtained at 3:30 P.M. on a weekday. Use the sample data to
construct a 98% confidence interval estimate of the population standard deviation.
62
60
60
56
60
53
61 60
61
70
59
68
Click the icon to view the table of Chi-Square critical values.
The confidence interval estimate is mi/h <o<
mi/h
(Round to one decimal place as needed.)
Expert Solution
This question has been solved!
Explore an expertly crafted, step-by-step solution for a thorough understanding of key concepts.

This is a popular solution!

Trending now
This is a popular solution!

Step by step
Solved in 2 steps

Knowledge Booster


Learn more about
Need a deep-dive on the concept behind this application? Look no further. Learn more about this topic, statistics and related others by exploring similar questions and additional content below.Recommended textbooks for you
MATLAB: An Introduction with Applications
Statistics
ISBN:
9781119256830
Author:
Amos Gilat
Publisher:
John Wiley & Sons Inc

Probability and Statistics for Engineering and th…
Statistics
ISBN:
9781305251809
Author:
Jay L. Devore
Publisher:
Cengage Learning

Statistics for The Behavioral Sciences (MindTap C…
Statistics
ISBN:
9781305504912
Author:
Frederick J Gravetter, Larry B. Wallnau
Publisher:
Cengage Learning
MATLAB: An Introduction with Applications
Statistics
ISBN:
9781119256830
Author:
Amos Gilat
Publisher:
John Wiley & Sons Inc
Probability and Statistics for Engineering and th…
Statistics
ISBN:
9781305251809
Author:
Jay L. Devore
Publisher:
Cengage Learning
Statistics for The Behavioral Sciences (MindTap C…
Statistics
ISBN:
9781305504912
Author:
Frederick J Gravetter, Larry B. Wallnau
Publisher:
Cengage Learning

Elementary Statistics: Picturing the World (7th E…
Statistics
ISBN:
9780134683416
Author:
Ron Larson, Betsy Farber
Publisher:
PEARSON

The Basic Practice of Statistics
Statistics
ISBN:
9781319042578
Author:
David S. Moore, William I. Notz, Michael A. Fligner
Publisher:
W. H. Freeman

Introduction to the Practice of Statistics
Statistics
ISBN:
9781319013387
Author:
David S. Moore, George P. McCabe, Bruce A. Craig
Publisher:
W. H. Freeman