Listed below are systolic blood pressure measurements (in mm Hg) obtained from the same woman. Find the regression equation, letting the right arm blood pressure be the predictor (x) variable. Find the best predicted systolic blood pressure in the left arm given that the systolic blood pressure in the right arm is 90 mm Hg. Use a significance level of 0.05. Right Arm 100 99 93 Left Arm 177 170 147 149 147 Click the icon to view the critical values of the Pearson correlation coefficient r The regression equation is y = x. (Round to one decimal place as needed.) Given that the systolic blood pressure in the right arm is 90 mm Hg, the best predicted systolic blood pressure in the left arm is (Round to one decimal place as needed.) mm Hg. Data Table Critical Values of the Pearson Correlation Coefficientr a = 0.05 a = 0.01 NOTE: To test Ho: 4 0.950 0.990 p = 0 against H1:p#0, 0.878 0.959 reject Ho if the absolute value of r is greater than the critical value in the table. 0.811 0.917 0.754 0.875 0.707 0.834 0.666 0.798 10 0.632 0.765 11 0.602 0.735 12 0.576 0.708 13 0.553 0.684 14 0.532 0.661 15 0.514 0.641 16 0.497 0.623 17 0.482 0.606 18 0.468 0.590 19 0.456 0.575 20 0.444 0.561 25 0.396 0.505 30 0.361 0.463 35 0.335 0.430 40 0.312 0.402 45 0.294 0.378 50 0.279 0.361 60 0.254 0.330 70 0.236 0.305 80 0 220. 0 286. Print Done
Listed below are systolic blood pressure measurements (in mm Hg) obtained from the same woman. Find the regression equation, letting the right arm blood pressure be the predictor (x) variable. Find the best predicted systolic blood pressure in the left arm given that the systolic blood pressure in the right arm is 90 mm Hg. Use a significance level of 0.05. Right Arm 100 99 93 Left Arm 177 170 147 149 147 Click the icon to view the critical values of the Pearson correlation coefficient r The regression equation is y = x. (Round to one decimal place as needed.) Given that the systolic blood pressure in the right arm is 90 mm Hg, the best predicted systolic blood pressure in the left arm is (Round to one decimal place as needed.) mm Hg. Data Table Critical Values of the Pearson Correlation Coefficientr a = 0.05 a = 0.01 NOTE: To test Ho: 4 0.950 0.990 p = 0 against H1:p#0, 0.878 0.959 reject Ho if the absolute value of r is greater than the critical value in the table. 0.811 0.917 0.754 0.875 0.707 0.834 0.666 0.798 10 0.632 0.765 11 0.602 0.735 12 0.576 0.708 13 0.553 0.684 14 0.532 0.661 15 0.514 0.641 16 0.497 0.623 17 0.482 0.606 18 0.468 0.590 19 0.456 0.575 20 0.444 0.561 25 0.396 0.505 30 0.361 0.463 35 0.335 0.430 40 0.312 0.402 45 0.294 0.378 50 0.279 0.361 60 0.254 0.330 70 0.236 0.305 80 0 220. 0 286. Print Done

College Algebra
7th Edition
ISBN:9781305115545
Author:James Stewart, Lothar Redlin, Saleem Watson
Publisher:James Stewart, Lothar Redlin, Saleem Watson
Chapter1: Equations And Graphs
Section: Chapter Questions
Problem 10T: Olympic Pole Vault The graph in Figure 7 indicates that in recent years the winning Olympic men’s...

Related questions
Question
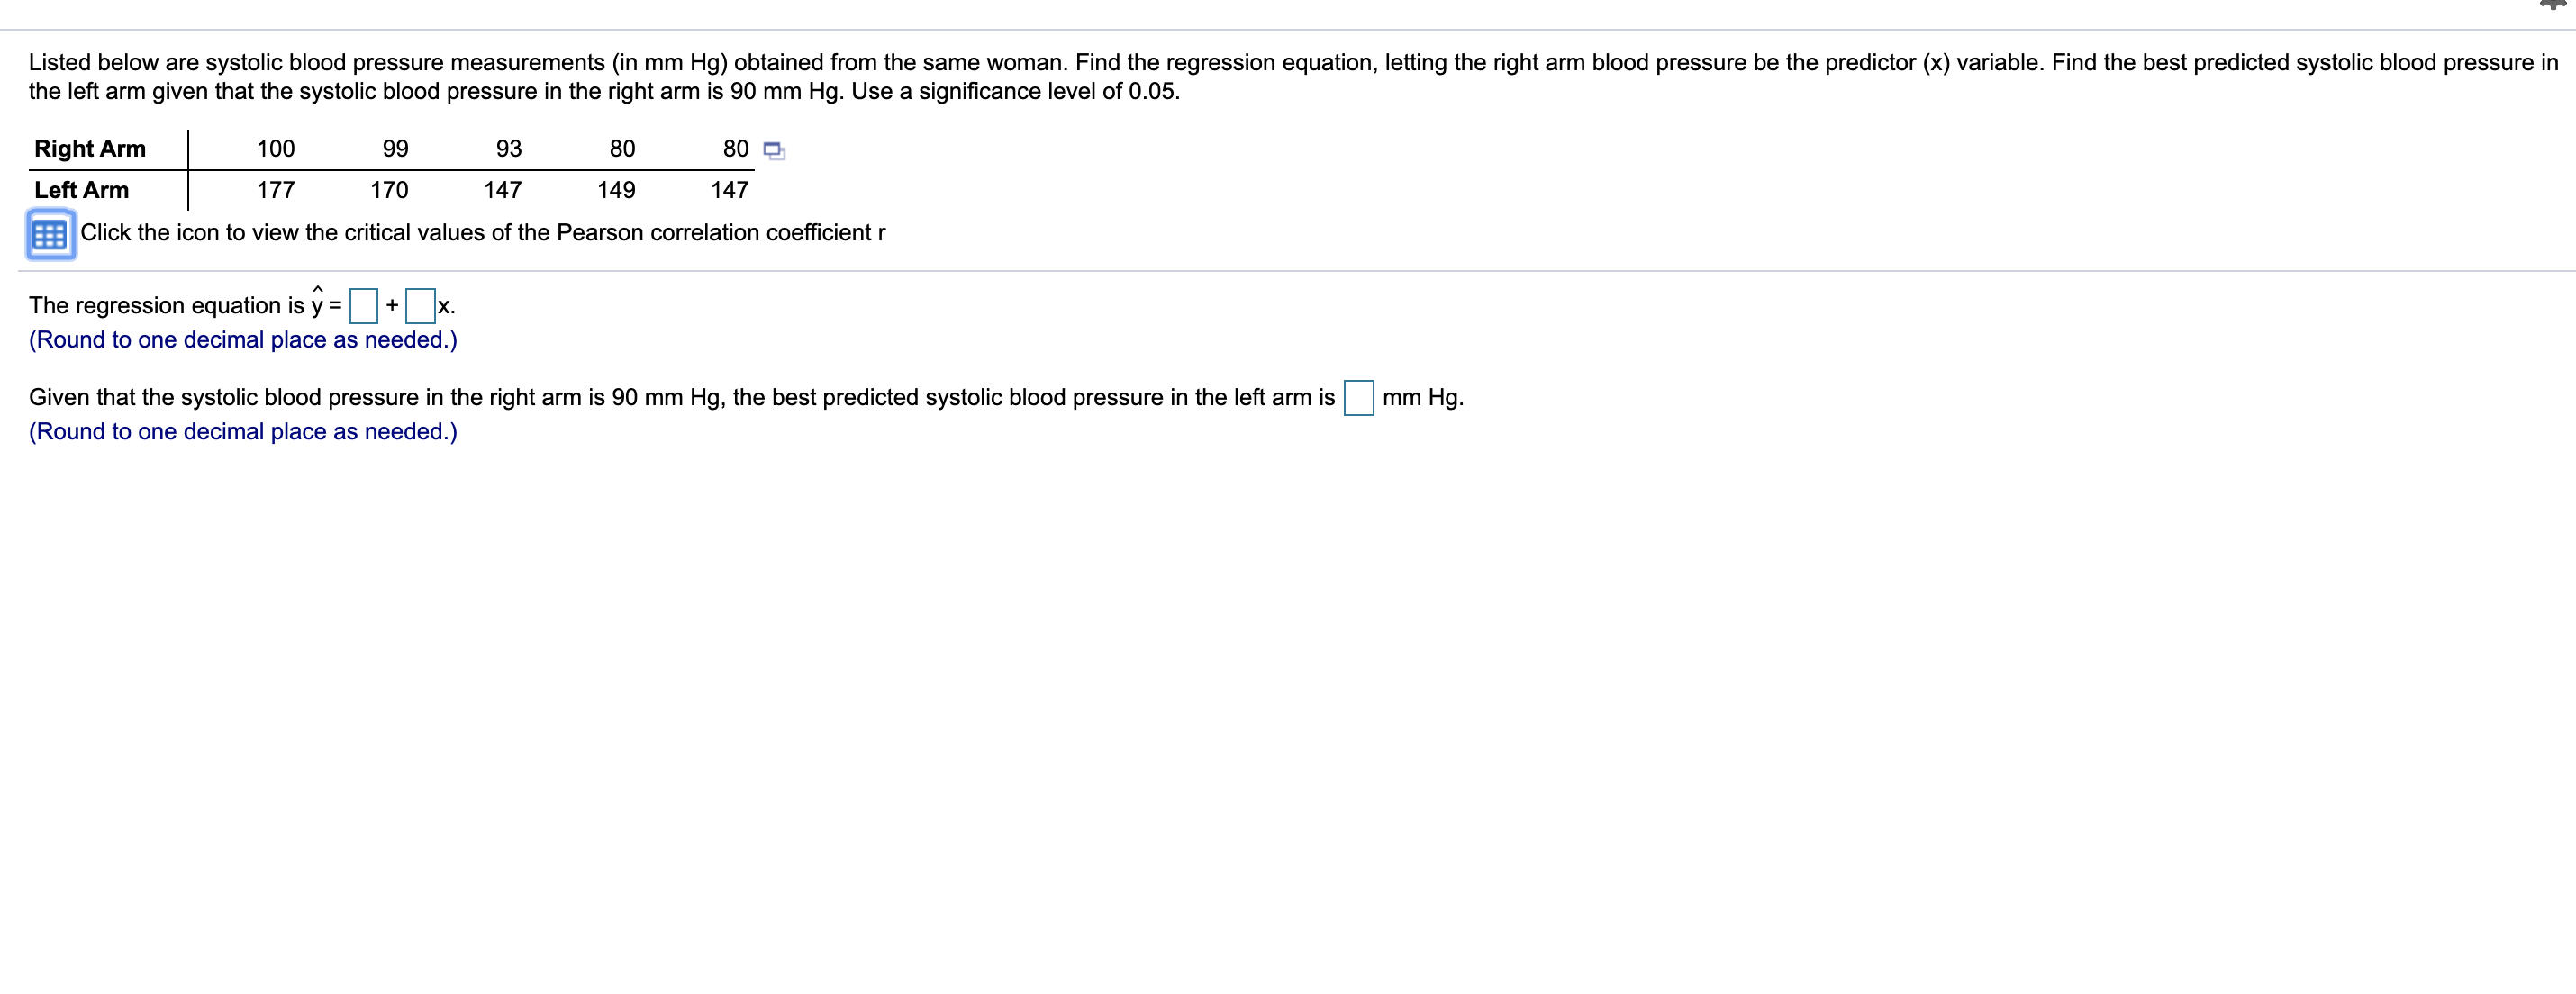
Transcribed Image Text:Listed below are systolic blood pressure measurements (in mm Hg) obtained from the same woman. Find the regression equation, letting the right arm blood pressure be the predictor (x) variable. Find the best predicted systolic blood pressure in
the left arm given that the systolic blood pressure in the right arm is 90 mm Hg. Use a significance level of 0.05.
Right Arm
100
99
93
Left Arm
177
170
147
149
147
Click the icon to view the critical values of the Pearson correlation coefficient r
The regression equation is y =
x.
(Round to one decimal place as needed.)
Given that the systolic blood pressure in the right arm is 90 mm Hg, the best predicted systolic blood pressure in the left arm is
(Round to one decimal place as needed.)
mm Hg.
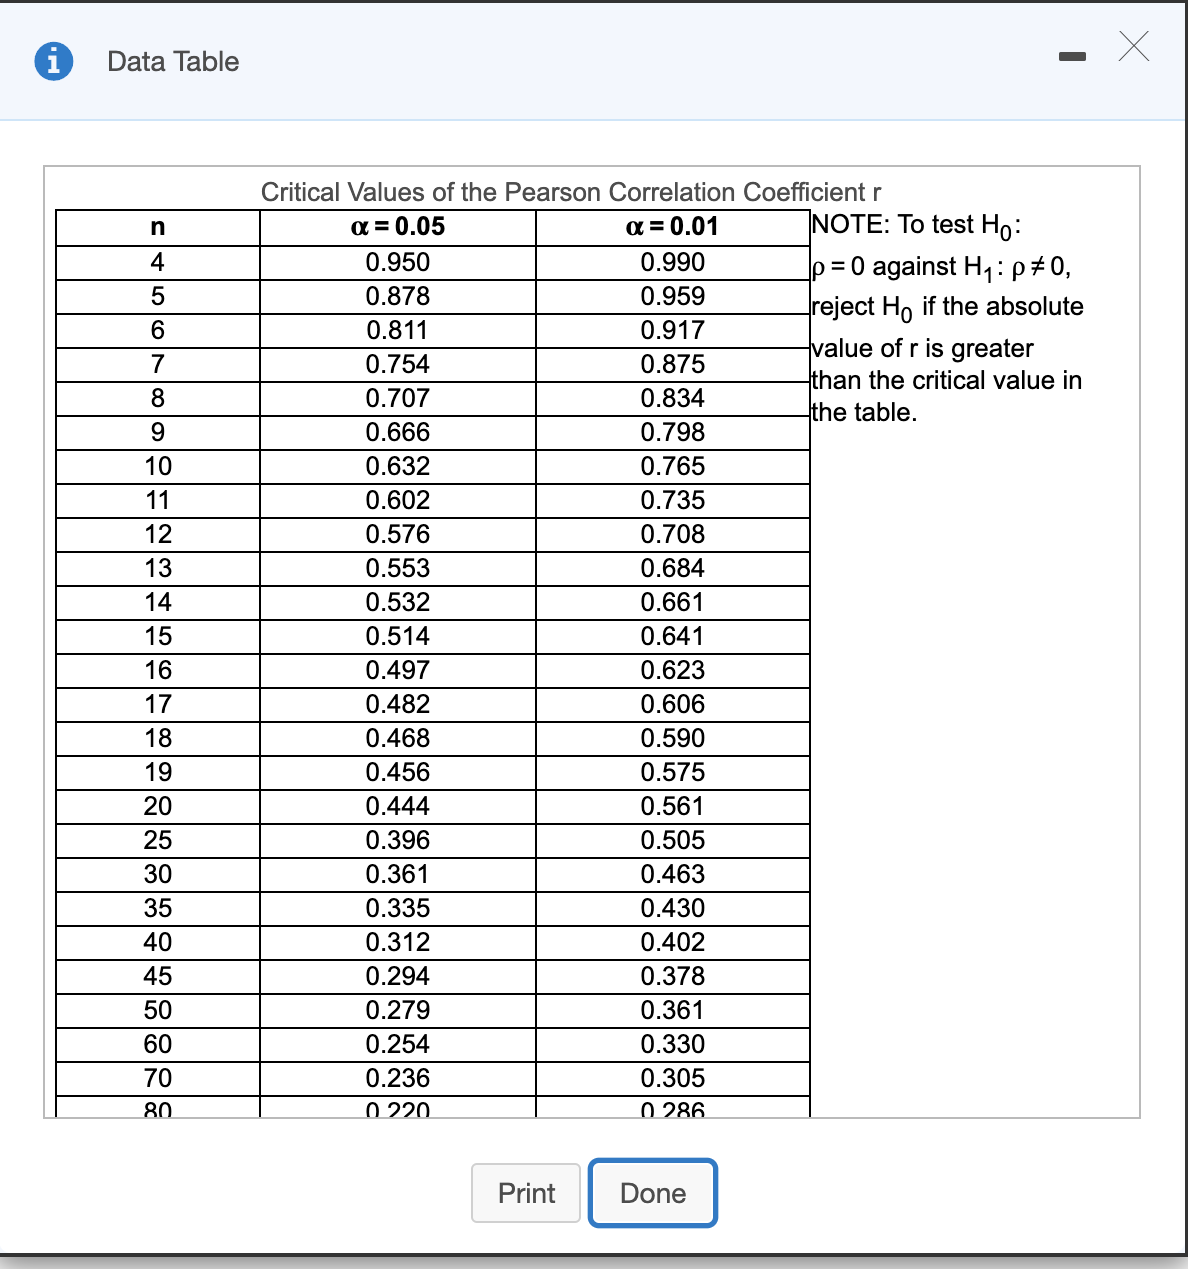
Transcribed Image Text:Data Table
Critical Values of the Pearson Correlation Coefficientr
a = 0.05
a = 0.01
NOTE: To test Ho:
4
0.950
0.990
p = 0 against H1:p#0,
0.878
0.959
reject Ho if the absolute
value of r is greater
than the critical value in
the table.
0.811
0.917
0.754
0.875
0.707
0.834
0.666
0.798
10
0.632
0.765
11
0.602
0.735
12
0.576
0.708
13
0.553
0.684
14
0.532
0.661
15
0.514
0.641
16
0.497
0.623
17
0.482
0.606
18
0.468
0.590
19
0.456
0.575
20
0.444
0.561
25
0.396
0.505
30
0.361
0.463
35
0.335
0.430
40
0.312
0.402
45
0.294
0.378
50
0.279
0.361
60
0.254
0.330
70
0.236
0.305
80
0 220.
0 286.
Print
Done
Expert Solution
This question has been solved!
Explore an expertly crafted, step-by-step solution for a thorough understanding of key concepts.

This is a popular solution!

Trending now
This is a popular solution!

Step by step
Solved in 3 steps with 4 images

Recommended textbooks for you
College Algebra
Algebra
ISBN:
9781305115545
Author:
James Stewart, Lothar Redlin, Saleem Watson
Publisher:
Cengage Learning


Algebra and Trigonometry (MindTap Course List)
Algebra
ISBN:
9781305071742
Author:
James Stewart, Lothar Redlin, Saleem Watson
Publisher:
Cengage Learning
College Algebra
Algebra
ISBN:
9781305115545
Author:
James Stewart, Lothar Redlin, Saleem Watson
Publisher:
Cengage Learning
Algebra and Trigonometry (MindTap Course List)
Algebra
ISBN:
9781305071742
Author:
James Stewart, Lothar Redlin, Saleem Watson
Publisher:
Cengage Learning

Glencoe Algebra 1, Student Edition, 9780079039897…
Algebra
ISBN:
9780079039897
Author:
Carter
Publisher:
McGraw Hill

Functions and Change: A Modeling Approach to Coll…
Algebra
ISBN:
9781337111348
Author:
Bruce Crauder, Benny Evans, Alan Noell
Publisher:
Cengage Learning