Listed below are systolic blood pressure measurements (in mm Hg) obtained from the same woman. Find the regression equation, letting the right arm blood pressure be the predictor (x) variable. Find the best predicted systolic blood pressu given that the systolic blood pressure in the right arm is 95 mm Hg. Use a significance level of 0.05. Right Arm 100 99 91 80 80 O Left Arm 176 169 181 142 144 E Click the icon to view the critical values of the Pearson correlation coefficient r The regression equation is y =+x
Listed below are systolic blood pressure measurements (in mm Hg) obtained from the same woman. Find the regression equation, letting the right arm blood pressure be the predictor (x) variable. Find the best predicted systolic blood pressu given that the systolic blood pressure in the right arm is 95 mm Hg. Use a significance level of 0.05. Right Arm 100 99 91 80 80 O Left Arm 176 169 181 142 144 E Click the icon to view the critical values of the Pearson correlation coefficient r The regression equation is y =+x

Chapter4: Linear Functions
Section: Chapter Questions
Problem 30PT: For the following exercises, use Table 4 which shows the percent of unemployed persons 25 years or...

Related questions
Question
6q
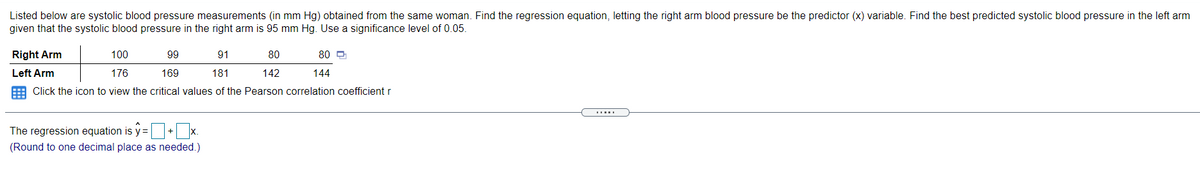
Transcribed Image Text:Listed below are systolic blood pressure measurements (in mm Hg) obtained from the same woman. Find the regression equation, letting the right arm blood pressure be the predictor (x) variable. Find the best predicted systolic blood pressure in the left arm
given that the systolic blood pressure in the right arm is 95 mm Hg. Use a significance level of 0.05.
Right Arm
100
99
91
80
80 O
Left Arm
176
169
181
142
144
E Click the icon to view the critical values of the Pearson correlation coefficient r
.....
The regression equation is y =+ x.
s%3D
(Round to one decimal place as needed.)
Expert Solution
This question has been solved!
Explore an expertly crafted, step-by-step solution for a thorough understanding of key concepts.

This is a popular solution!

Trending now
This is a popular solution!

Step by step
Solved in 3 steps with 1 images

Recommended textbooks for you

College Algebra
Algebra
ISBN:
9781305115545
Author:
James Stewart, Lothar Redlin, Saleem Watson
Publisher:
Cengage Learning

Glencoe Algebra 1, Student Edition, 9780079039897…
Algebra
ISBN:
9780079039897
Author:
Carter
Publisher:
McGraw Hill
College Algebra
Algebra
ISBN:
9781305115545
Author:
James Stewart, Lothar Redlin, Saleem Watson
Publisher:
Cengage Learning
Glencoe Algebra 1, Student Edition, 9780079039897…
Algebra
ISBN:
9780079039897
Author:
Carter
Publisher:
McGraw Hill

Algebra and Trigonometry (MindTap Course List)
Algebra
ISBN:
9781305071742
Author:
James Stewart, Lothar Redlin, Saleem Watson
Publisher:
Cengage Learning

Functions and Change: A Modeling Approach to Coll…
Algebra
ISBN:
9781337111348
Author:
Bruce Crauder, Benny Evans, Alan Noell
Publisher:
Cengage Learning