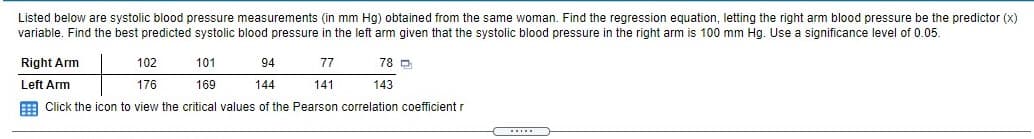
Listed below are systolic blood pressure measurements (in mm Hg) obtained from the same woman. Find the regression equation, letting the right arm blood pressure be the predictor (x) variable. Find the best predicted systolic blood pressure in the left arm given that the systolic blood pressure in the right arm is 100 mm Hg. Use a significance level of 0.05. Right Arm 102 101 94 77 78 D Left Arm 176 169 144 141 143 E Click the icon to view the critical values of the Pearson correlation coefficient r
Listed below are systolic blood pressure measurements (in mm Hg) obtained from the same woman. Find the regression equation, letting the right arm blood pressure be the predictor (x) variable. Find the best predicted systolic blood pressure in the left arm given that the systolic blood pressure in the right arm is 100 mm Hg. Use a significance level of 0.05. Right Arm 102 101 94 77 78 D Left Arm 176 169 144 141 143 E Click the icon to view the critical values of the Pearson correlation coefficient r

College Algebra
7th Edition
ISBN:9781305115545
Author:James Stewart, Lothar Redlin, Saleem Watson
Publisher:James Stewart, Lothar Redlin, Saleem Watson
Chapter1: Equations And Graphs
Section: Chapter Questions
Problem 10T: Olympic Pole Vault The graph in Figure 7 indicates that in recent years the winning Olympic men’s...

Related questions
Question
8- Hi Great Bartleby Team, I need help with this stats exercise, it has 3 parts so please provide an answer for all the parts. Thanks in advance. (please pay attention to the image posted.
Transcribed Image Text:Listed below are systolic blood pressure measurements (in mm Hg) obtained from the same woman. Find the regression equation, letting the right arm blood pressure be the predictor (x)
variable. Find the best predicted systolic blood pressure in the left arm given that the systolic blood pressure in the right arm is 100 mm Hg. Use a significance level of 0.05.
Right Arm
102
101
94
77
78 D
Left Arm
176
169
144
141
143
E Click the icon to view the critical values of the Pearson correlation coefficient r
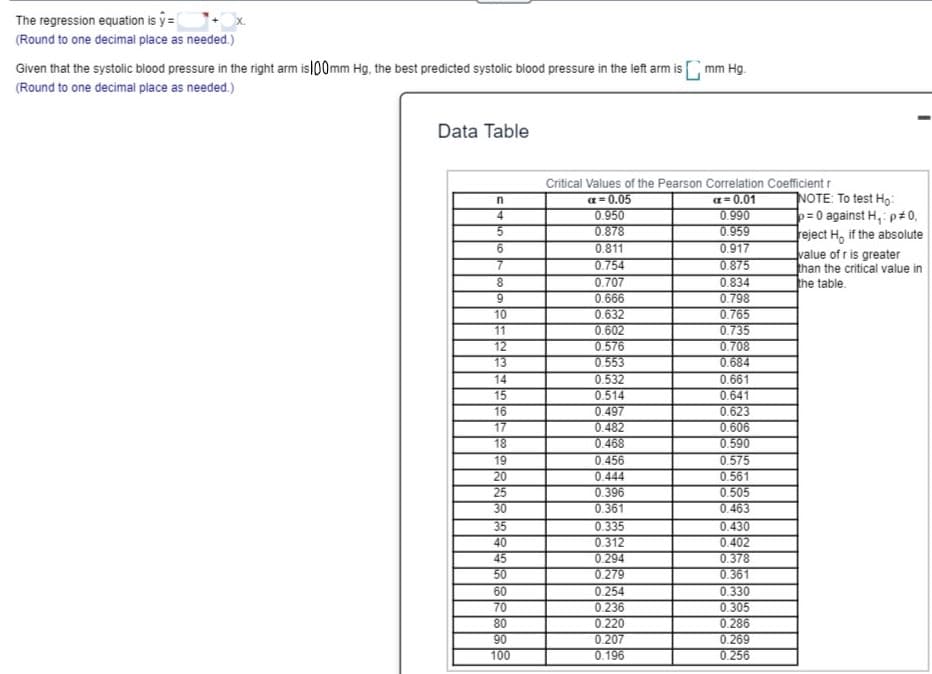
Transcribed Image Text:The regression equation is y =
(Round to one decimal place as needed.)
Given that the systolic blood pressure in the right arm is|00mm Hg, the best predicted systolic blood pressure in the left arm is mm Hg.
(Round to one decimal place as needed.)
Data Table
Critical Values of the Pearson Correlation Coefficient r
NOTE: To test Ho:
=0 against H,: p#0,
Feject H, if the absolute
value of r is greater
than the critical value in
he table.
a= 0.05
0.950
0.878
0.811
0.754
0.707
0.666
0.632
0.602
0.576
0.553
0.532
0.514
0.497
0.482
0.468
0.456
0.444
0.396
0.361
0.335
0.312
0.294
0.279
0.254
0.236
0.220
a= 0.01
0.990
0.959
n
4
0.917
0.875
0.834
0.798
0.765
0.735
0.708
0.684
0.661
0.641
0.623
0.606
0.590
0.575
9
10
11
12
13
14
15
16
17
18
19
20
0.561
0.505
0.463
0.430
0.402
0.378
0.361
25
30
35
40
45
50
60
0.330
0.305
0.286
70
80
90
0.207
0.269
0.256
100
0.196
Expert Solution
This question has been solved!
Explore an expertly crafted, step-by-step solution for a thorough understanding of key concepts.

This is a popular solution!

Trending now
This is a popular solution!

Step by step
Solved in 3 steps with 1 images

Recommended textbooks for you
College Algebra
Algebra
ISBN:
9781305115545
Author:
James Stewart, Lothar Redlin, Saleem Watson
Publisher:
Cengage Learning

Glencoe Algebra 1, Student Edition, 9780079039897…
Algebra
ISBN:
9780079039897
Author:
Carter
Publisher:
McGraw Hill

Algebra and Trigonometry (MindTap Course List)
Algebra
ISBN:
9781305071742
Author:
James Stewart, Lothar Redlin, Saleem Watson
Publisher:
Cengage Learning
College Algebra
Algebra
ISBN:
9781305115545
Author:
James Stewart, Lothar Redlin, Saleem Watson
Publisher:
Cengage Learning
Glencoe Algebra 1, Student Edition, 9780079039897…
Algebra
ISBN:
9780079039897
Author:
Carter
Publisher:
McGraw Hill
Algebra and Trigonometry (MindTap Course List)
Algebra
ISBN:
9781305071742
Author:
James Stewart, Lothar Redlin, Saleem Watson
Publisher:
Cengage Learning

Functions and Change: A Modeling Approach to Coll…
Algebra
ISBN:
9781337111348
Author:
Bruce Crauder, Benny Evans, Alan Noell
Publisher:
Cengage Learning