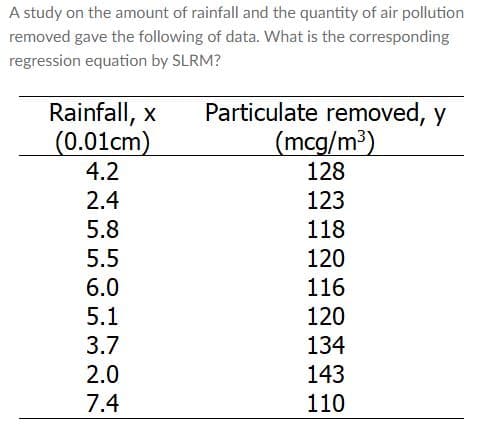
A study on the amount of rainfall and the quantity of air pollution removed gave the following of data. What is the corresponding regression equation by SLRM? Rainfall, x (0.01cm) 4.2 Particulate removed, y (mcg/m³) 128 2.4 123 5.8 118 5.5 120 6.0 116 5.1 3.7 120 134 2.0 143 7.4 110
Q: Use the pizza cost and the subway fare in the table below to find the regression equation, letting…
A: The regression is used to estimate the future value and the relationship between the independent and…
Q: Listed below are foot lengths (mm) and heights (mm) of males. Find the regression equation, letting…
A: Excel Procedure: Enter x and y in Excel>Data>Data Analysis> ‘Regression’>Select y under…
Q: Consider the following scenario for Questions 6 through 9: The City of Bellmore’s police chief…
A: Solution: Note: Hello! As you have posted more than 3 sub parts, we are answering the first 3…
Q: Find the slope of the regression line for the following data. 3
A: The regression is the measure that is used to find the unknown value of one variable using the known…
Q: Personal wealth tends to increase with age as older individuals have had more opportunities to earn…
A: (d). Determine there is a significant relationship between wealth and age at the 10% level of…
Q: A regression between foot length (y) ( in cm) and height (x) ( in inches) for 33 students resulted…
A: regression between foot length (y) ( in cm) and height (x) ( in inches) for 33 students resulted in…
Q: A group of students measure the length and width of a random sample of beans. They are interested in…
A: d) Compute the slope of the regression line using the formula: b=rsysx Where, 'b' is the estimated…
Q: Listed below are systolic blood pressure measurements (in mm Hg) obtained from the same woman.…
A:
Q: Use the sample data given in table x 1 2 3 4 5 y 3 4 1 2 1 a) To Write the regression equation…
A: Given Data : X Y 1 3 2 3 3 1 4 2 5 1 Below table will be used to calculate the…
Q: The owner of Showtime Movie Theaters, Inc., would like to predict weekly gross revenueas a function…
A: Hi! Thank you for the question, As per the honor code, we are allowed to answer three sub-parts at a…
Q: Personal wealth tends to increase with age as older individuals have had more opportunities to earn…
A: Note: Hey, since multiple sub parts are posted, we will answer first three sub parts according to…
Q: consider the following sample of production volumes and total cost data for manuracturing operation.…
A: The null hypothesis in simple linear regression is that the slope is zero and the alternate…
Q: Listed below are the overhead widths (am) of seals measured from photographs and weights (kg) of the…
A:
Q: 1. The table shows the rate of injury among young workers compared to the actual number of injury…
A: Given: X Y 1165711612110069980110401059586308962946010280…
Q: A study of the amount of rainfall and the quantity of air pollution removed produced the following…
A: Introduction - Linear regression Linear regression is way to meet the relationship between two…
Q: The owner of Showtime Movie Theaters, Inc. would like to predict weekly gross revenue as a function…
A: To find regression line using R software: 1. Enter the data of x and y variables. 2. Use command…
Q: A group of students measure the length and width of a random sample of beans. They are interested in…
A: d) Compute the estimated slope of the regression line using the formula: b=rsysx Where, 'b' is the…
Q: A marketing manager conducted a study to determine the…
A: Given Information: Intercept = 104.062 Slope = 50.730 R-squared value is 0.8340
Q: A specialist in hospital administration stated that no. of employees in a hospital can be estimated…
A: Given information: The data represents the values of number of beds and employees.
Q: An agent for a real estate company in a large city would like to be able to predict the monthly…
A: Enter the given data into the excel as follows:
Q: (d) (e) Calculate the coefficient of Pearson correlation. If the surrounding temperature in the…
A: Followings are the Explanation of the question
Q: Suppose we wanted to predict the number of people killed for a magnitude 10.0 earthquake. Using the…
A:
Q: Working as a professor, I may want to try and predict success on a final exam by student success on…
A: The independent variable is first exam score. The dependent variable is final exam score. We have to…
Q: Cigarettes consumed per capita in 1930 (X) 530 1115 1145 510 380 Observation # Country Switzerland…
A:
Q: In a given city, age and monthly incomes are found as follows. According to these data; a) Find…
A: From the below calculation: (a) -> Beta_0 = 4414.761869 Beta_1 = 48.39795 So, Regression line…
Q: The accompanying table shows results from regressions performed on data from a random sample of 21…
A: Given
Q: The training manager of a company that assembles and exports pool pumps wants to know if there is a…
A: Formula : Slope = SSxy /SSxx
Q: Mental development in humans is related to the volume of the part of the brain known as the…
A: The regression output is given shows that the mental development index at age 24 months versus…
Q: The accompanying table shows results from regressions performed on data from a random sample of 21…
A: Determine the best predicted value of the city fuel consumption. The best predicted value of the…
Q: Use the pizza cost and the subway fare in the table below to find the regression equation, letting…
A: X = Pizza Cost Y= Subway Fare X Y 0.152 0.152 0.348 0.350 0.996 1 1.247 1.346 1.754…
Q: Personal wealth tends to increase with age as older individuals have had more opportunities to earn…
A: "Since you have posted a question with multiple sub-parts, we will solve first three sub-parts for…
Q: A survey was conducted to study the retationship between expenditure on accommodation (X) and…
A:
Q: Below you are given a summary of the output from a simple linear regression analysis from a sample…
A:
Q: A random sample of records of home sales from March 1 to July 1, 2010 from the files maintained by…
A: Regression equation Y=Intercept +slope. X Whre Y is predicted price X is size
Q: The amount of kerosene used by a typical household in a week (Q, in litres) is found to have a…
A: Given information: Q P 11.4 4.00 14 3.50 16 3.00 18 2.50 20 2.00 22 1.50
Q: For the data given below from a simple linear regression model, the computed value of the sum square…
A: The formula of SSE is,
Q: Answer the following questions using the SPSS regression analysis OUTPUT (given below): a. From the…
A: 3. a. From the SPSS output, the intercept is 76.960, and the slope is -4.495. The estimated…
Q: A sociologist is interested in the relation between ?, the number of job changes and ?, the annual…
A: x y 4 33 7 37 5 34 6 32 1 32 5 38 9 43 10 37 10 40 3 33 The simple linear…
Q: Listed below are systolic blood pressure measurements (in mm H) obtained from the same woman. Find…
A:
Q: Consider the output shown in Table 4.1. What is the value of the regression df? 1 3
A: From the given information, the residual degrees of freedom is 16 and the total degrees of freedom…
Q: For the data shown below, Find the best -fit regression equation. 1.661 1.931| 0.545 0.186 0.010…
A: Step-by-step procedure to find the regression equation using Excel: In Excel sheet, enter X in one…
Q: Given data below where x=neckline and y=waistline n=15 Answer the following: a. Standard Error of…
A: Given: n = 15 Formula Used:
Q: Consider the following data on x = weight (pounds) and y = price ($) for 10 road-racing bikes.…
A: Given information SSE = 7,209,342.96 and SST = 50,969,800. SSR = 50,969,800 - 7,209,342.96 =…
Q: The regional transit authority for a major metropolitan area wants to determine whetherthere is a…
A: Hey, since there are multiple subparts posted, we will answer first three subparts. If you want any…
Q: The accompanying table shows results from regressions performed on data from a random sample of 21…
A: The table of regression equations given in the question is: sample size n= 21 y: response variable…
Q: Working as a professor, I may want to try and predict success on a final exam by student success on…
A: (1) Use EXCEL to obtain the value correlation coefficient r: EXCEL procedure: Go to EXCEL Go to…
Q: A study of the amount of rainfall and the quantity of air pollution removed produced the following…
A:
Q: A regression was run to determine if there is a relationship between hours of study per week (x) and…
A: From the given information, y=ax+b a=5.78 b=30.04 Therefore, the regression equation is…
Q: The accompanying table provides data for tar, nicotine, and carbon monoxide (CO) contents in a…
A: Regression equation is found using Excel. The steps to calculate simple regression are- 1) Go to the…
Trending now
This is a popular solution!
Step by step
Solved in 2 steps
- Table 6 shows the population, in thousands, of harbor seals in the Wadden Sea over the years 1997 to 2012. a. Let x represent time in years starting with x=0 for the year 1997. Let y represent the number of seals in thousands. Use logistic regression to fit a model to these data. b. Use the model to predict the seal population for the year 2020. c. To the nearest whole number, what is the limiting value of this model?Find the equation of the regression line for the following data set. x 1 2 3 y 0 3 4Determine the best (according to sum-of-squares-measure) curve y = Aebx , through the data above. Transformed equation ln(y) = ln(A) + bx or Y = a + bx.
- Consider a linear regression model for the decrease in blood pressure (mmHg) over a four-week period with muy=2.8+0.8x and standard deviation chi=3.2. The explanatory variable x is the number of servings fruits and vegetables in a calorie-controlled diet. What is the slope of the population regression line?Consider the following data, i) Calculate and analyze the fitted regression line between the electricity flow (amp) andthe resistance capacity (ohm) in different circuits.ii) Find the coefficient of determination and interpret your data.iii) Predict electron flow when resistance capacity is 12 (ohm)Consider a linear regression model for the decrease in blood pressure (mmHg) over a four-week period with muy=2.8+0.8x and standard deviation chi=3.2. The explanatory variable x is the number of servings fruits and vegetables in a calorie-controlled diet. What is the subpopulation mean when x = 7 servings per day?
- Based on these charts what is the predicted level of spending per pupil in the District of Columbia? What is the residual (the difference between actual and predicted value) for DC? Does the model over or under predict spending per pupil in DC? What factors might account for this error?Consider a linear regression model for the decrease in blood pressure (mmHg) over a four-week period with muy=2.8+0.8x and standard deviation chi=3.2. The explanatory variable x is the number of servings fruits and vegetables in a calorie-controlled diet. Explain clearly what this slope says about the change in the mean of y for a change in x.Consider a linear regression model for the decrease in blood pressure (mmHg) over a four-week period with muy=2.8+0.8x and standard deviation chi=3.2. The explanatory variable x is the number of servings fruits and vegetables in a calorie-controlled diet. The decrease in blood pressure y will vary about this subpopulation mean. What is the distribution of y for this subpopulation?
- Accountants at the Tucson firm, Larry Youdelman,CPAs, believed that several traveling executives were submittingunusually high travel vouchers when they returned from businesstrips. First, they took a sample of 200 vouchers submitted from the past year. Then they developed the following multiple-regres-sion equation relating expected travel cost to number of days on the road ( x1 ) and distance traveled ( x2 ) in miles:yn = +90.00 + +48.50x1 + +.40x2The coefficient of correlation computed was .68.a) If Donna Battista returns from a 300-mile trip that took herout of town for 5 days, what is the expected amount she shouldclaim as expenses?b) Battista submitted a reimbursement request for $685. Whatshould the accountant do?c) Should any other variables be included? Which ones? Why?The sulfate ion concentration in natural water can be determined by measuring the turbidity that results when an excess of BaCl2 is added to a measured quantity of the sample. A turbiditimeter, the instrument used for this analysis, was calibrated with a series of standard Na2SO4 solutions. The following data were obtained for the calibration:In a study of exhaust emissions from school buses, the pollution intake by passengers was determined for a sample of nine school buses used in the Southern California Air Basin. The pollution intake is the amount of exhaust emissions, in grams per person, that would be inhaled while traveling on the bus during its usual 1818‑mile trip on congested freeways from South Central LA to a magnet school in West LA. (As a reference, the average intake of motor emissions of carbon monoxide in the LA area is estimated to be about 0.0000460.000046 grams per person.) The amounts for the nine buses when driven with the windows open are given. 1.151.15 0.330.33 0.400.40 0.330.33 1.351.35 0.380.38 0.250.25 0.400.40 0.350.35 A good way to judge the effect of outliers is to do your analysis twice, once with the outliers and a second time without them. Give two 90%90% confidence intervals, one with all the data and one with the outliers removed, for the mean pollution intake among all school buses…