Listed below are systolic blood pressure measurements (mm Hg) taken from the right and left arms of the same woman Assume that the paired sample data is a simple random sample and that the dfterences have a distribution that is approxmately normal. Use a 0.05 significance level to lest for a difference between the measurements from the two arms. What can be concluded? Right arm Left arm 151 149 116 129 133 184 164 182 140 150 In this example, Pa is the mean value of the differences d for the population of all pairs of data, where each individual difference d is defined as the measurement from the right arm minus the measurement from the left arm What are the null and alternative hypotheses for the hypothess fest? O A. Ho Ha=0 OB. H, Ha=0 OD. Ha Ps0 H =0 OC. Ho Ha 40 Identify the test statistic t=(Round to two decimal places as needed) Identify the P-value P.value = (Round to three decimal places as needed.) What is the conclusion based on the hypothesis test? V the null hypothesis. There V sutficient evidence to support the claim of a difference in measurements between the two arms Since the P-value is v than the significance level,
Listed below are systolic blood pressure measurements (mm Hg) taken from the right and left arms of the same woman Assume that the paired sample data is a simple random sample and that the dfterences have a distribution that is approxmately normal. Use a 0.05 significance level to lest for a difference between the measurements from the two arms. What can be concluded? Right arm Left arm 151 149 116 129 133 184 164 182 140 150 In this example, Pa is the mean value of the differences d for the population of all pairs of data, where each individual difference d is defined as the measurement from the right arm minus the measurement from the left arm What are the null and alternative hypotheses for the hypothess fest? O A. Ho Ha=0 OB. H, Ha=0 OD. Ha Ps0 H =0 OC. Ho Ha 40 Identify the test statistic t=(Round to two decimal places as needed) Identify the P-value P.value = (Round to three decimal places as needed.) What is the conclusion based on the hypothesis test? V the null hypothesis. There V sutficient evidence to support the claim of a difference in measurements between the two arms Since the P-value is v than the significance level,

MATLAB: An Introduction with Applications
6th Edition
ISBN:9781119256830
Author:Amos Gilat
Publisher:Amos Gilat
Chapter1: Starting With Matlab
Section: Chapter Questions
Problem 1P

Related questions
Question
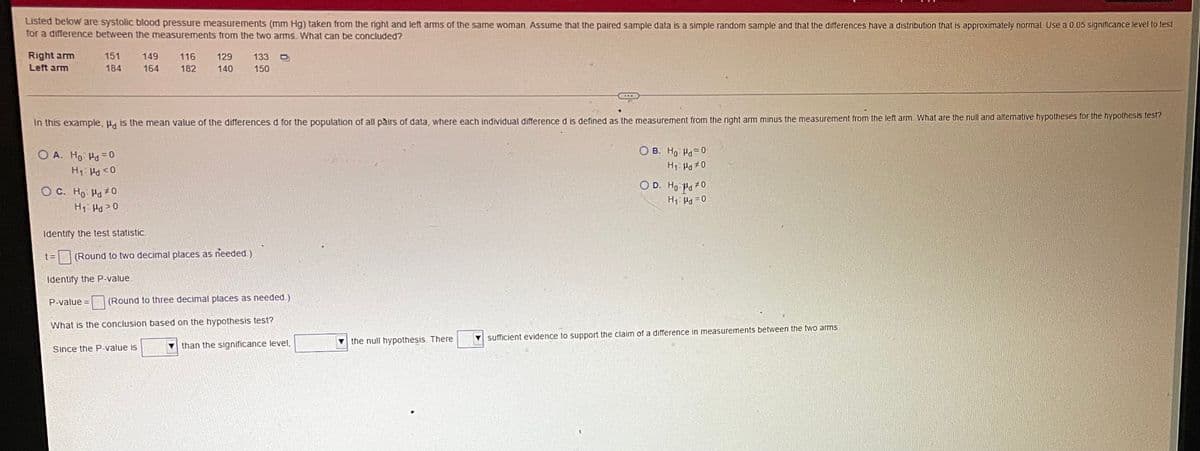
Transcribed Image Text:Listed below are systolic blood pressure measurements (mm Hg) taken from the right and left arms of the same woman. Assume that the paired sample data is a simple random sample and that the differences have a distribution that is approximately normal. Use a 0.05 significance level to test
for a difference between the measurements from the two arms. What can be concluded?
Right arm
Left arm
151
149
116
129
133
184
164
182
140
150
In this example, Pd is the mean value of the differences d for the population of all pairs of data, where each individual difference d is defined as the measurement from the right arm minus the measurement from the left arm What are the null and alternative hypotheses for the hypothesis test?
O A. Ho Ha=0
O B. Ho Ha=0
O D. Ho Pa 0
O C. Ho Ho#0
H1 Hd> 0
Identify the test statistic.
t =
(Round to two decimal places as needed.)
Identify the P-value.
P-value =
(Round to three decimal places as needed.)
What is the conclusion based on the hypothesis test?
the null hypothesis. There
sufficient evidence to support the claim of a difference in measurements between the two ams
Since the P-value is
than the significance level,
Expert Solution
This question has been solved!
Explore an expertly crafted, step-by-step solution for a thorough understanding of key concepts.

This is a popular solution!

Trending now
This is a popular solution!

Step by step
Solved in 5 steps with 1 images

Recommended textbooks for you
MATLAB: An Introduction with Applications
Statistics
ISBN:
9781119256830
Author:
Amos Gilat
Publisher:
John Wiley & Sons Inc

Probability and Statistics for Engineering and th…
Statistics
ISBN:
9781305251809
Author:
Jay L. Devore
Publisher:
Cengage Learning

Statistics for The Behavioral Sciences (MindTap C…
Statistics
ISBN:
9781305504912
Author:
Frederick J Gravetter, Larry B. Wallnau
Publisher:
Cengage Learning
MATLAB: An Introduction with Applications
Statistics
ISBN:
9781119256830
Author:
Amos Gilat
Publisher:
John Wiley & Sons Inc
Probability and Statistics for Engineering and th…
Statistics
ISBN:
9781305251809
Author:
Jay L. Devore
Publisher:
Cengage Learning
Statistics for The Behavioral Sciences (MindTap C…
Statistics
ISBN:
9781305504912
Author:
Frederick J Gravetter, Larry B. Wallnau
Publisher:
Cengage Learning

Elementary Statistics: Picturing the World (7th E…
Statistics
ISBN:
9780134683416
Author:
Ron Larson, Betsy Farber
Publisher:
PEARSON

The Basic Practice of Statistics
Statistics
ISBN:
9781319042578
Author:
David S. Moore, William I. Notz, Michael A. Fligner
Publisher:
W. H. Freeman

Introduction to the Practice of Statistics
Statistics
ISBN:
9781319013387
Author:
David S. Moore, George P. McCabe, Bruce A. Craig
Publisher:
W. H. Freeman