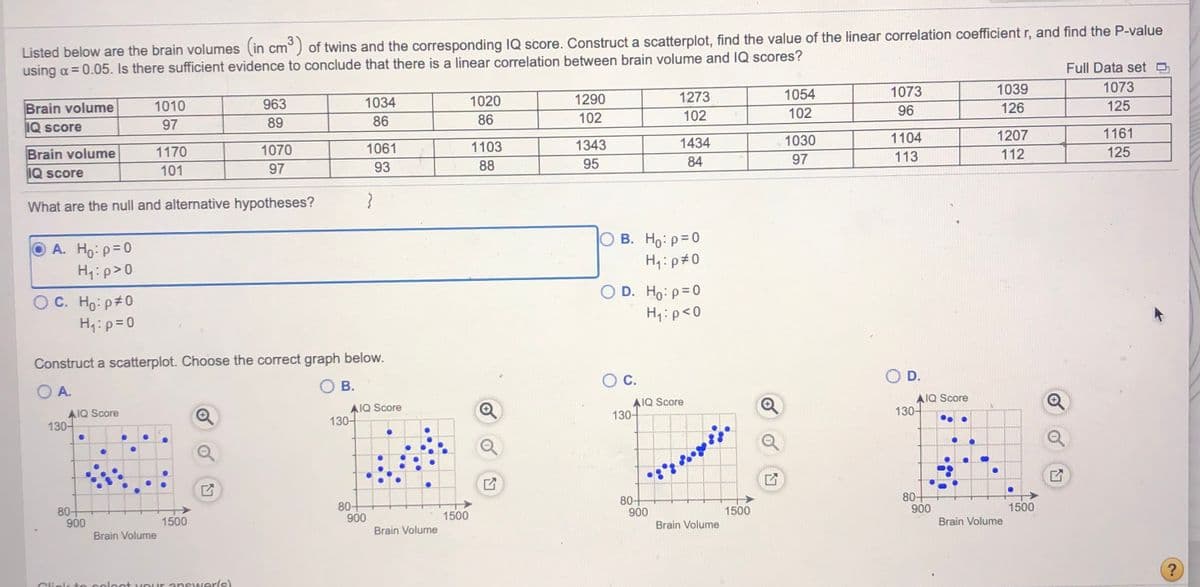
Listed below are the brain volumes (in cm°) of twins and the corresponding lIQ score. Construct a scatterplot, find the value of the linear correlation coefficient r, and find the P-value using a =0.05. Is there sufficient evidence to conclude that there is a linear correlation between brain volume and IQ scores? Full Data set o 1054 1073 1039 1073 Brain volume 963 1034 1020 1290 1273 1010 102 96 126 125 89 86 86 102 102 IQ score 97 1030 1104 1207 1161 1061 1103 1343 1434 Brain volume IQ score 1170 1070 84 113 112 125 97 93 88 95 97 101 What are the null and alternative hypotheses? O B. Ho: p=0 H: p#0 O A. Ho: p=0 H,:p>0 O D. Ho: p=0 H,:p<0 OC. Ho: p#0 H.n=0
Listed below are the brain volumes (in cm°) of twins and the corresponding lIQ score. Construct a scatterplot, find the value of the linear correlation coefficient r, and find the P-value using a =0.05. Is there sufficient evidence to conclude that there is a linear correlation between brain volume and IQ scores? Full Data set o 1054 1073 1039 1073 Brain volume 963 1034 1020 1290 1273 1010 102 96 126 125 89 86 86 102 102 IQ score 97 1030 1104 1207 1161 1061 1103 1343 1434 Brain volume IQ score 1170 1070 84 113 112 125 97 93 88 95 97 101 What are the null and alternative hypotheses? O B. Ho: p=0 H: p#0 O A. Ho: p=0 H,:p>0 O D. Ho: p=0 H,:p<0 OC. Ho: p#0 H.n=0

Glencoe Algebra 1, Student Edition, 9780079039897, 0079039898, 2018
18th Edition
ISBN:9780079039897
Author:Carter
Publisher:Carter
Chapter4: Equations Of Linear Functions
Section4.5: Correlation And Causation
Problem 11PPS

Related questions
Question
this is the copy of the complete question. thank you
Transcribed Image Text:Listed below are the brain volumes (in cm
using a = 0.05. Is there sufficient evidence to conclude that there is a linear correlation between brain volume and IQ scores?
) of twins and the corresponding IQ score. Construct a scatterplot, find the value of the linear correlation coefficient r, and find the P-value
Full Data set
%3D
1054
1073
1039
1073
963
1034
1020
1290
1273
Brain volume
1010
102
96
126
125
89
86
86
102
102
IQ score
97
1030
1104
1207
1161
1170
1070
1061
1103
1343
1434
125
Brain volume
97
113
112
101
97
93
88
95
84
IQ Score
What are the null and alternative hypotheses?
O A. Ho: p=0
H4:p>0
O B. Ho: p=0
Hip#0
OC. Ho: p#0
H:p=0
O D. Ho: p=0
H1:p<0
Construct a scatterplot. Choose the correct graph below.
C.
O D.
O A.
O B.
AIQ Score
130-
AIQ Score
130-
AIQ Score
130-
A IQ Score
130-
80+
900
80+
900
80+
900
Brain Volume
1500
80+
900
Brain Volume
1500
1500
1500
Brain Volume
Brain Volume
Click to colect vour answer(s)
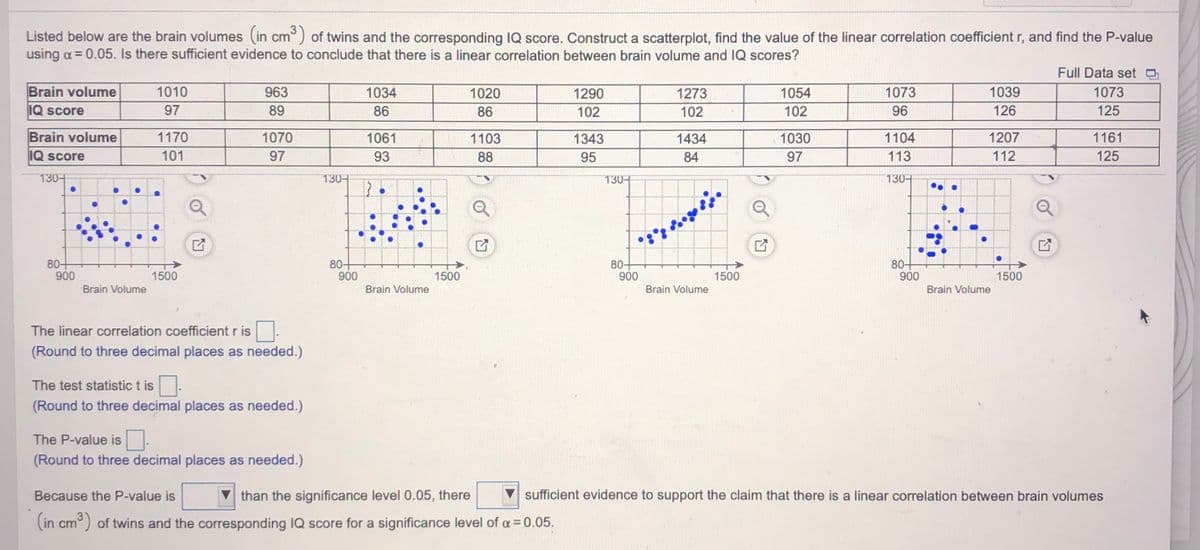
Transcribed Image Text:Listed below are the brain volumes (in cm°) of twins and the corresponding IQ score. Construct a scatterplot, find the value of the linear correlation coefficient r, and find the P-value
using a = 0.05. Is there sufficient evidence to conclude that there is a linear correlation between brain volume and IQ scores?
Full Data set
Brain volume
IQ Score
1010
963
1034
1020
1290
1273
1054
1073
1039
1073
97
89
86
86
102
102
102
96
126
125
Brain volume
1170
1070
1061
1103
1343
1434
1030
1104
1207
1161
IQ Score
101
97
93
88
95
84
97
113
112
125
130-
130-
130
130+
80+
900
80+
900
80+
900
80-
900
1500
1500
1500
1500
Brain Volume
Brain Volume
Brain Volume
Brain Volume
The linear correlation coefficient r is
(Round to three decimal places as needed.)
The test statistic t is
(Round to three decimal places as needed.)
The P-value is:
(Round to three decimal places as needed.)
Because the P-value is
than the significance level 0.05, there
sufficient evidence to support the claim that there is a linear correlation between brain volumes
(in cm°) of twins and the corresponding IQ score for a significance level of a = 0.05.
...
Expert Solution
This question has been solved!
Explore an expertly crafted, step-by-step solution for a thorough understanding of key concepts.

This is a popular solution!

Trending now
This is a popular solution!

Step by step
Solved in 2 steps with 2 images

Knowledge Booster


Learn more about
Need a deep-dive on the concept behind this application? Look no further. Learn more about this topic, statistics and related others by exploring similar questions and additional content below.Recommended textbooks for you
Glencoe Algebra 1, Student Edition, 9780079039897…
Algebra
ISBN:
9780079039897
Author:
Carter
Publisher:
McGraw Hill
Glencoe Algebra 1, Student Edition, 9780079039897…
Algebra
ISBN:
9780079039897
Author:
Carter
Publisher:
McGraw Hill