Listed below are time intervals (min) between eruptions of a geyser. Assume that the "recent" times are within the past few years, the "past" times are from around 20 years ago, and that the two samples are independent simple random samples selected from normally distributed populations. Do not assume that the population standard deviations are equal. Does it appear that the mean time interval has changed? Is the conclusion affected by whether the significance level is 0.10 or 0.01? Recent 77 92 90 80 56 100 61 86 69 89 83 82 55 81 75 101 62 O Past 90 88 93 94 65 85 85 92 88 91 91 91 t=(Round to two decimal places as needed.) Find the P-value. P-value = (Round to three decimal places as needed.) Make a conclusion about the null hypothesis and a final conclusion that addresses the original claim. Use a significance level of 0.10. V the significance level. There V sufficient evidence that the mean time interval has V H, because the P-value is changed. Is the conclusion affected bv whether the sianificance level is 0.10 or 0.01?
Listed below are time intervals (min) between eruptions of a geyser. Assume that the "recent" times are within the past few years, the "past" times are from around 20 years ago, and that the two samples are independent simple random samples selected from normally distributed populations. Do not assume that the population standard deviations are equal. Does it appear that the mean time interval has changed? Is the conclusion affected by whether the significance level is 0.10 or 0.01? Recent 77 92 90 80 56 100 61 86 69 89 83 82 55 81 75 101 62 O Past 90 88 93 94 65 85 85 92 88 91 91 91 t=(Round to two decimal places as needed.) Find the P-value. P-value = (Round to three decimal places as needed.) Make a conclusion about the null hypothesis and a final conclusion that addresses the original claim. Use a significance level of 0.10. V the significance level. There V sufficient evidence that the mean time interval has V H, because the P-value is changed. Is the conclusion affected bv whether the sianificance level is 0.10 or 0.01?

MATLAB: An Introduction with Applications
6th Edition
ISBN:9781119256830
Author:Amos Gilat
Publisher:Amos Gilat
Chapter1: Starting With Matlab
Section: Chapter Questions
Problem 1P

Related questions
Question
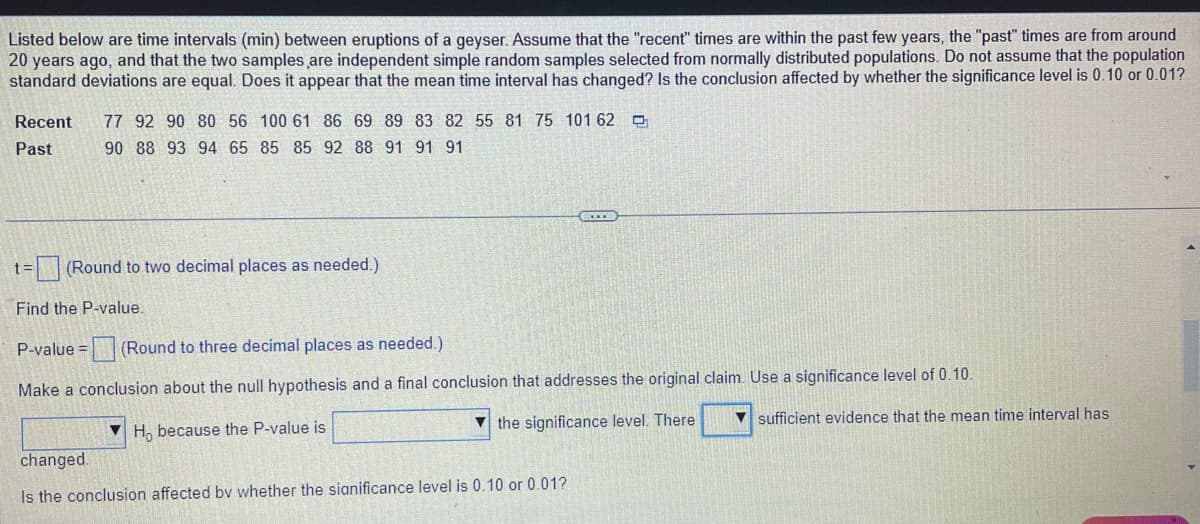
Transcribed Image Text:Listed below are time intervals (min) between eruptions of a geyser. Assume that the "recent" times are within the past few years, the "past" times are from around
20 years ago, and that the two samples are independent simple random samples selected from normally distributed populations. Do not assume that the population
standard deviations are equal. Does it appear that the mean time interval has changed? Is the conclusion affected by whether the significance level is 0.10 or 0.01?
Recent
77 92 90 80 56 100 61 86 69 89 83 82 55 81 75 101 62 O
Past
90 88 93 94 65 85 85 92 88 91 91 91
= (Round to two decimal places as needed.)
Find the P-value.
P-value = (Round to three decimal places as needed.)
Make a conclusion about the null hypothesis and a final conclusion that addresses the original claim. Use a significance level of 0.10.
V the significance level. There
sufficient evidence that the mean time interval has
H, because the P-value is
changed.
Is the conclusion affected by whether the sianificance level is 0.10 or 0.01?
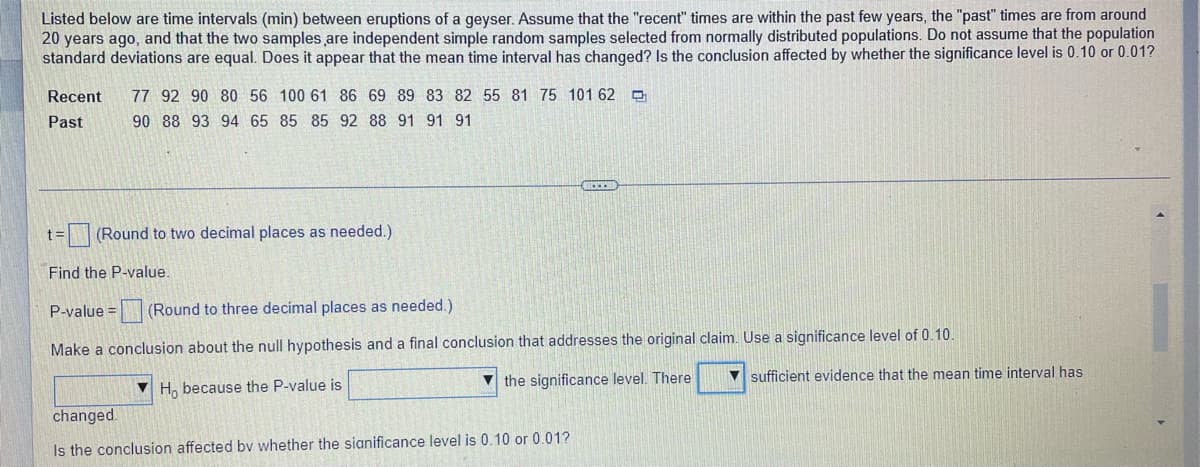
Transcribed Image Text:Listed below are time intervals (min) between eruptions of a geyser. Assume that the "recent" times are within the past few years, the "past" times are from around
20 years ago, and that the two samples are independent simple random samples selected from normally distributed populations. Do not assume that the population
standard deviations are equal. Does it appear that the mean time interval has changed? Is the conclusion affected by whether the significance level is 0.10 or 0.01?
Recent
77 92 90 80 56 100 61 86 69 89 83 82 55 81 75 101 62 O
Past
90 88 93 94 65 85 85 92 88 91 91 91
t=(Round to two decimal places as needed.)
Find the P-value.
P-value = (Round to three decimal places as needed.)
Make a conclusion about the null hypothesis and a final conclusion that addresses the original claim. Use a significance level of 0.10.
V the significance level. There
V sufficient evidence that the mean time interval has
V H, because the P-value is
changed.
Is the conclusion affected bv whether the sianificance level is 0.10 or 0.01?
Expert Solution
This question has been solved!
Explore an expertly crafted, step-by-step solution for a thorough understanding of key concepts.

Step by step
Solved in 2 steps with 1 images

Recommended textbooks for you
MATLAB: An Introduction with Applications
Statistics
ISBN:
9781119256830
Author:
Amos Gilat
Publisher:
John Wiley & Sons Inc

Probability and Statistics for Engineering and th…
Statistics
ISBN:
9781305251809
Author:
Jay L. Devore
Publisher:
Cengage Learning

Statistics for The Behavioral Sciences (MindTap C…
Statistics
ISBN:
9781305504912
Author:
Frederick J Gravetter, Larry B. Wallnau
Publisher:
Cengage Learning
MATLAB: An Introduction with Applications
Statistics
ISBN:
9781119256830
Author:
Amos Gilat
Publisher:
John Wiley & Sons Inc
Probability and Statistics for Engineering and th…
Statistics
ISBN:
9781305251809
Author:
Jay L. Devore
Publisher:
Cengage Learning
Statistics for The Behavioral Sciences (MindTap C…
Statistics
ISBN:
9781305504912
Author:
Frederick J Gravetter, Larry B. Wallnau
Publisher:
Cengage Learning

Elementary Statistics: Picturing the World (7th E…
Statistics
ISBN:
9780134683416
Author:
Ron Larson, Betsy Farber
Publisher:
PEARSON

The Basic Practice of Statistics
Statistics
ISBN:
9781319042578
Author:
David S. Moore, William I. Notz, Michael A. Fligner
Publisher:
W. H. Freeman

Introduction to the Practice of Statistics
Statistics
ISBN:
9781319013387
Author:
David S. Moore, George P. McCabe, Bruce A. Craig
Publisher:
W. H. Freeman