Listed in the data table are IQ scores for a random sample of subjects with medium lead levels in their blood. Also listed are statistics from a study done of IQ scores for a random sample of subjects with high lead levels. Assume that the two samples are independent simple random samples selected from normally distributed populations. Do not assume that the population standard deviations are equal. Complete parts (a) and (b) below. Click the icon to view the data table of IQ scores. a. Use a 0.05 significance level to test the claim that the mean IQ scores for subjects with medium lead levels is higher than the mean for subjects with high lead levels. What are the null and alternative hypotheses? Assume that population 1 consists of subjects with medium lead levels and population 2 consists of subjects with high lead levels. X OA. Ho: H₁ H₂ H₁: Hy > H₂ c. Ho: H₁ = H2 H₁: H₁ H₂ The test statistic is 0.56. (Round to two decimal places as needed.) The P-value is. (Round to three decimal places as needed.) IQ Scores Medium Lead Level High Lead Level 72 n₂ = 11 90 X2 = 88.900 $2 = 9.857 92 85 89 97 83 92
Listed in the data table are IQ scores for a random sample of subjects with medium lead levels in their blood. Also listed are statistics from a study done of IQ scores for a random sample of subjects with high lead levels. Assume that the two samples are independent simple random samples selected from normally distributed populations. Do not assume that the population standard deviations are equal. Complete parts (a) and (b) below. Click the icon to view the data table of IQ scores. a. Use a 0.05 significance level to test the claim that the mean IQ scores for subjects with medium lead levels is higher than the mean for subjects with high lead levels. What are the null and alternative hypotheses? Assume that population 1 consists of subjects with medium lead levels and population 2 consists of subjects with high lead levels. X OA. Ho: H₁ H₂ H₁: Hy > H₂ c. Ho: H₁ = H2 H₁: H₁ H₂ The test statistic is 0.56. (Round to two decimal places as needed.) The P-value is. (Round to three decimal places as needed.) IQ Scores Medium Lead Level High Lead Level 72 n₂ = 11 90 X2 = 88.900 $2 = 9.857 92 85 89 97 83 92

Linear Algebra: A Modern Introduction
4th Edition
ISBN:9781285463247
Author:David Poole
Publisher:David Poole
Chapter7: Distance And Approximation
Section7.3: Least Squares Approximation
Problem 31EQ

Related questions
Question
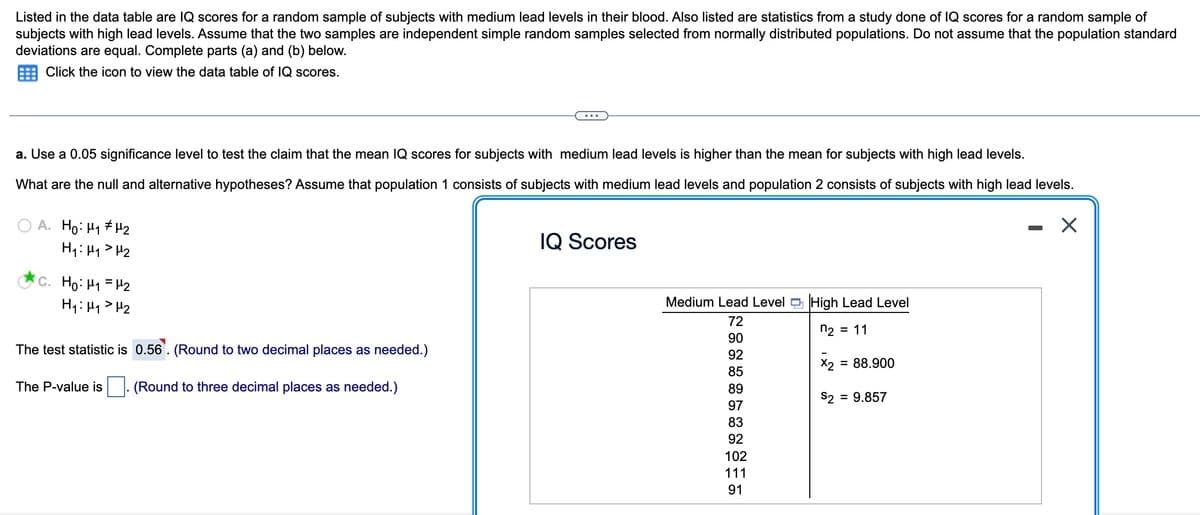
Transcribed Image Text:Listed in the data table are IQ scores for a random sample of subjects with medium lead levels in their blood. Also listed are statistics from a study done of IQ scores for a random sample of
subjects with high lead levels. Assume that the two samples are independent simple random samples selected from normally distributed populations. Do not assume that the population standard
deviations are equal. Complete parts (a) and (b) below.
Click the icon to view the data table of IQ scores.
a. Use a 0.05 significance level to test the claim that the mean IQ scores for subjects with medium lead levels is higher than the mean for subjects with high lead levels.
What are the null and alternative hypotheses? Assume that population 1 consists of subjects with medium lead levels and population 2 consists of subjects with high lead levels.
X
A. Ho: H₁ H₂
H₁ H₁ H₂
c. Ho: M₁ = H₂
H₁: H₁ H₂
The test statistic is 0.56. (Round to two decimal places as needed.)
The P-value is (Round to three decimal places as needed.)
IQ Scores
Medium Lead Level High Lead Level
72
n₂ = 11
90
92
85
89
97
83
92
102
111
91
= 88.900
X2
S2 = 9.857
-
Expert Solution
This question has been solved!
Explore an expertly crafted, step-by-step solution for a thorough understanding of key concepts.

Step by step
Solved in 5 steps with 18 images

Recommended textbooks for you
Linear Algebra: A Modern Introduction
Algebra
ISBN:
9781285463247
Author:
David Poole
Publisher:
Cengage Learning

Glencoe Algebra 1, Student Edition, 9780079039897…
Algebra
ISBN:
9780079039897
Author:
Carter
Publisher:
McGraw Hill
Linear Algebra: A Modern Introduction
Algebra
ISBN:
9781285463247
Author:
David Poole
Publisher:
Cengage Learning
Glencoe Algebra 1, Student Edition, 9780079039897…
Algebra
ISBN:
9780079039897
Author:
Carter
Publisher:
McGraw Hill