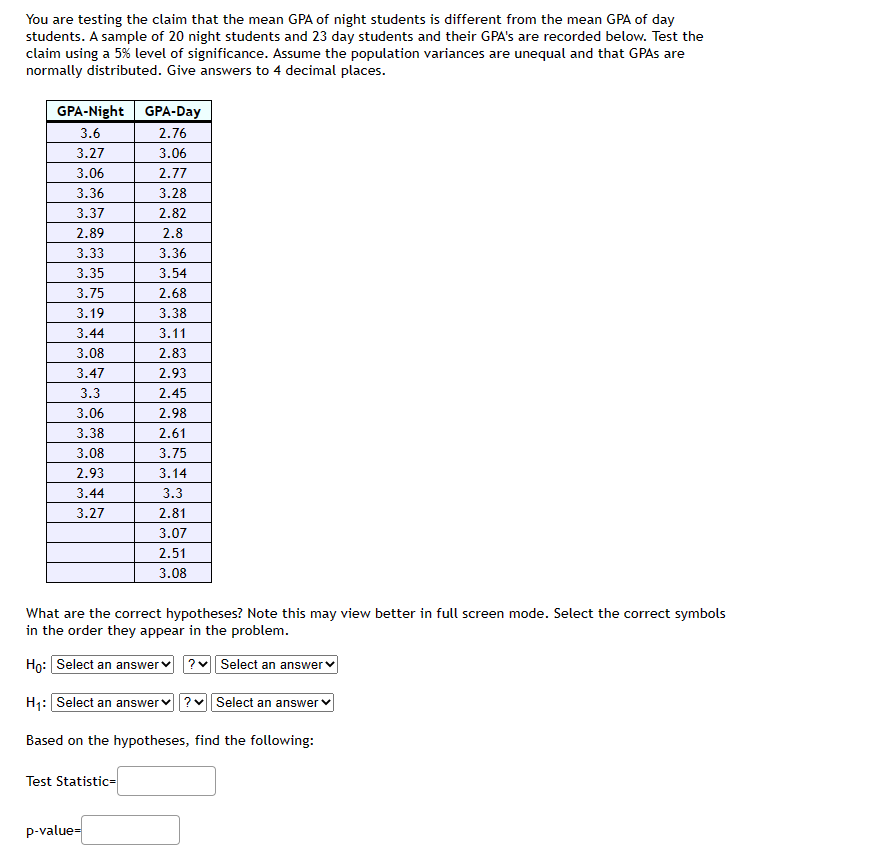
You are testing the claim that the mean GPA of night students is different from the mean GPA of day students. A sample of 20 night students and 23 day students and their GPA's are recorded below. Test the claim using a 5% level of significance. Assume the population variances are unequal and that GPAs are normally distributed. Give answers to 4 decimal places.
You are testing the claim that the mean GPA of night students is different from the mean GPA of day students. A sample of 20 night students and 23 day students and their GPA's are recorded below. Test the claim using a 5% level of significance. Assume the population variances are unequal and that GPAs are normally distributed. Give answers to 4 decimal places.

Glencoe Algebra 1, Student Edition, 9780079039897, 0079039898, 2018
18th Edition
ISBN:9780079039897
Author:Carter
Publisher:Carter
Chapter10: Statistics
Section10.4: Distributions Of Data
Problem 22PFA

Related questions
Question
Transcribed Image Text:You are testing the claim that the mean GPA of night students is different from the mean GPA of day
students. A sample of 20 night students and 23 day students and their GPA's are recorded below. Test the
claim using a 5% level of significance. Assume the population variances are unequal and that GPAs are
normally distributed. Give answers to 4 decimal places.
GPA-Night GPA-Day
3.6
2.76
3.27
3.06
3.06
2.77
3.36
3.28
3.37
2.82
2.89
2.8
3.33
3.35
3.75
3.19
3.44
3.08
3.47
3.3
3.06
3.38
3.08
2.93
3.44
3.27
What are the correct hypotheses? Note this may view better in full screen mode. Select the correct symbols
in the order they appear in the problem.
Ho: Select an answer ? Select an answer
H₁: Select an answer ? Select an answer
Based on the hypotheses, find the following:
Test Statistic=
3.36
3.54
2.68
3.38
3.11
2.83
2.93
2.45
2.98
2.61
3.75
3.14
3.3
2.81
3.07
2.51
3.08
p-value=
Expert Solution
This question has been solved!
Explore an expertly crafted, step-by-step solution for a thorough understanding of key concepts.

Step by step
Solved in 6 steps with 7 images

Recommended textbooks for you
Glencoe Algebra 1, Student Edition, 9780079039897…
Algebra
ISBN:
9780079039897
Author:
Carter
Publisher:
McGraw Hill
Glencoe Algebra 1, Student Edition, 9780079039897…
Algebra
ISBN:
9780079039897
Author:
Carter
Publisher:
McGraw Hill