llustration 12.24. The sales of a company for the last eight years are given as: Year: 1973 1974 1975 1976 1977 1978 1979 1980 Sates *000: 52 45 98 92 185 175 220 Estimate the sales figures for 1981 using the trend y=ab* where x= year and y=sales.
llustration 12.24. The sales of a company for the last eight years are given as: Year: 1973 1974 1975 1976 1977 1978 1979 1980 Sates *000: 52 45 98 92 185 175 220 Estimate the sales figures for 1981 using the trend y=ab* where x= year and y=sales.

Chapter3: Functions
Section3.3: Rates Of Change And Behavior Of Graphs
Problem 26SE: Table 3 gives the annual sales (in millions of dollars) of a product from 1998 to 20006. What was...

Related questions
Question
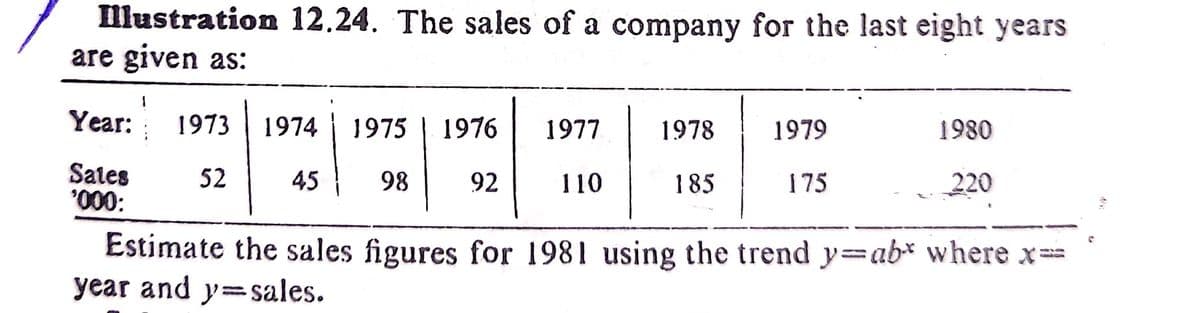
Transcribed Image Text:Illustration 12.24. The sales of a company for the last eight years
are given as:
Year: 1973
1974
1975
1976
1977
1978
1979
1980
Sates
*000:
52
45
98
92
110
185
175
220
Estimate the sales figures for 1981 using the trend y=ab* where x3D
year and y=sales.
Expert Solution
This question has been solved!
Explore an expertly crafted, step-by-step solution for a thorough understanding of key concepts.

Step by step
Solved in 3 steps with 3 images

Recommended textbooks for you

College Algebra (MindTap Course List)
Algebra
ISBN:
9781305652231
Author:
R. David Gustafson, Jeff Hughes
Publisher:
Cengage Learning

Functions and Change: A Modeling Approach to Coll…
Algebra
ISBN:
9781337111348
Author:
Bruce Crauder, Benny Evans, Alan Noell
Publisher:
Cengage Learning
College Algebra (MindTap Course List)
Algebra
ISBN:
9781305652231
Author:
R. David Gustafson, Jeff Hughes
Publisher:
Cengage Learning
Functions and Change: A Modeling Approach to Coll…
Algebra
ISBN:
9781337111348
Author:
Bruce Crauder, Benny Evans, Alan Noell
Publisher:
Cengage Learning