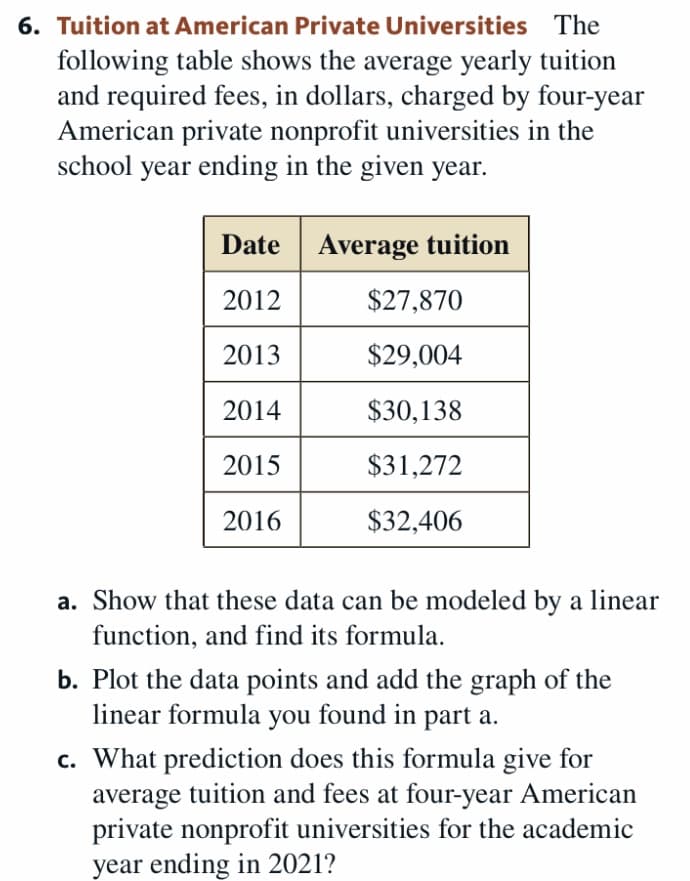
lốh at Amer te sities following table shows the average yearly tuition and required fees, in dollars, charged by four-year American private nonprofit universities in the school year ending in the given year. Date | Average tuition 2012 $27,870 2013 $29,004 2014 $30,138 2015 $31,272 2016 $32,406 a. Show that these data can be modeled by a linear function, and find its formula. b. Plot the data points and add the graph of the linear formula you found in part a. c. What prediction does this formula give for average tuition and fees at four-year American private nonprofit universities for the academic year ending in 2021?


Correlation
Correlation defines a relationship between two independent variables. It tells the degree to which variables move in relation to each other. When two sets of data are related to each other, there is a correlation between them.
Linear Correlation
A correlation is used to determine the relationships between numerical and categorical variables. In other words, it is an indicator of how things are connected to one another. The correlation analysis is the study of how variables are related.
Regression Analysis
Regression analysis is a statistical method in which it estimates the relationship between a dependent variable and one or more independent variable. In simple terms dependent variable is called as outcome variable and independent variable is called as predictors. Regression analysis is one of the methods to find the trends in data. The independent variable used in Regression analysis is named Predictor variable. It offers data of an associated dependent variable regarding a particular outcome.


Trending now
This is a popular solution!

Step by step
Solved in 2 steps with 1 images


