The table shows the total number of trade apprenticeships Canada each year from 1991 to 1997 a) Consider the year 1991 as year #0. Create a scatter plot of the data on the next page using the DESMOS graphing calculator. apprenticeships 192,945 Year 1991 1992 180,965 1993 168,985 1994 163,750 1995 163,370 165,325 171,180 1996 1997 b) From the scatter plot, which model appears most appropriate: linear, quadratic, exponential. Give reason for your answer c) Generate a model for the data (line/curve of best fit) using regression. Write the equation of the model that best fits the data.
The table shows the total number of trade apprenticeships Canada each year from 1991 to 1997 a) Consider the year 1991 as year #0. Create a scatter plot of the data on the next page using the DESMOS graphing calculator. apprenticeships 192,945 Year 1991 1992 180,965 1993 168,985 1994 163,750 1995 163,370 165,325 171,180 1996 1997 b) From the scatter plot, which model appears most appropriate: linear, quadratic, exponential. Give reason for your answer c) Generate a model for the data (line/curve of best fit) using regression. Write the equation of the model that best fits the data.

Holt Mcdougal Larson Pre-algebra: Student Edition 2012
1st Edition
ISBN:9780547587776
Author:HOLT MCDOUGAL
Publisher:HOLT MCDOUGAL
Chapter11: Data Analysis And Probability
Section11.1: Stem-and-leaf Plots And Histograms
Problem 9E

Related questions
Question
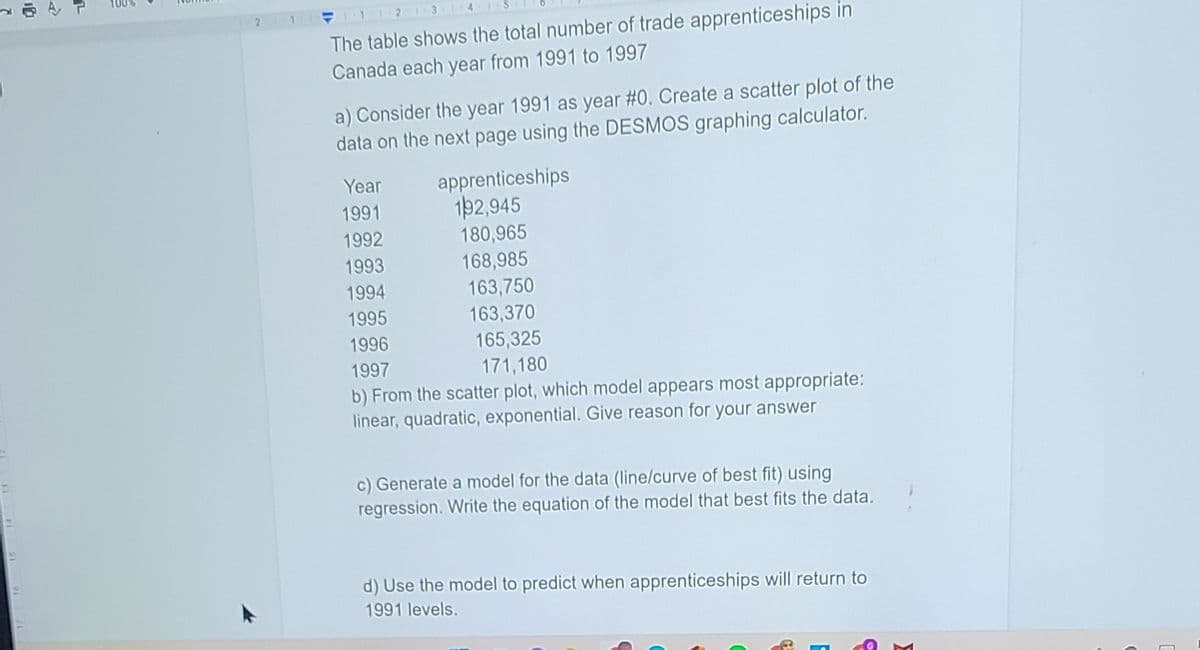
Transcribed Image Text:The table shows the total number of trade apprenticeships in
Canada each year from 1991 to 1997
a) Consider the year 1991 as year #0. Create a scatter plot of the
data on the next page using the DESMOS graphing calculator.
apprenticeships
192,945
Year
1991
1992
180,965
168,985
163,750
163,370
1993
1994
1995
1996
165,325
171,180
1997
b) From the scatter plot, which model appears most appropriate:
linear, quadratic, exponential. Give reason for your answer
c) Generate a model for the data (line/curve of best fit) using
regression. Write the equation of the model that best fits the data.
d) Use the model to predict when apprenticeships will return to
1991 levels.
Expert Solution
This question has been solved!
Explore an expertly crafted, step-by-step solution for a thorough understanding of key concepts.

Step by step
Solved in 2 steps with 6 images

Recommended textbooks for you
Holt Mcdougal Larson Pre-algebra: Student Edition…
Algebra
ISBN:
9780547587776
Author:
HOLT MCDOUGAL
Publisher:
HOLT MCDOUGAL
Holt Mcdougal Larson Pre-algebra: Student Edition…
Algebra
ISBN:
9780547587776
Author:
HOLT MCDOUGAL
Publisher:
HOLT MCDOUGAL