Look at the data below regarding the variables x = lowest barometric pressure as a cyclone approaches and y = maximum wind speed of the cyclone. Is the value of |r| large enough to conclude that lowest barometric pressure and wind speed of a cyclone are correlated? Use ? = 0.01. (Round your answer for r to four decimal places.)
Look at the data below regarding the variables x = lowest barometric pressure as a cyclone approaches and y = maximum wind speed of the cyclone. Is the value of |r| large enough to conclude that lowest barometric pressure and wind speed of a cyclone are correlated? Use ? = 0.01. (Round your answer for r to four decimal places.)

MATLAB: An Introduction with Applications
6th Edition
ISBN:9781119256830
Author:Amos Gilat
Publisher:Amos Gilat
Chapter1: Starting With Matlab
Section: Chapter Questions
Problem 1P

Related questions
Question
Look at the data below regarding the variables x = lowest barometric pressure as a cyclone approaches and y = maximum wind speed of the cyclone. Is the value of |r| large enough to conclude that lowest barometric pressure and wind speed of a cyclone are
x 1004 975 992 935 970 928
y 40 100 65 145 70 151
r = ______
critical r = ______
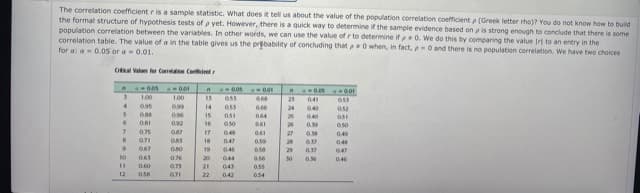
Transcribed Image Text:The correlation coefficient r is a sample statistic. What does it tell us about the value of the population correlation coefficient p (Greek letter rho)? You do not know haow to build
the formal structure of hypothesis tests of p yet. However, there is a quick way to determine if the sample evidence based on a is strong enough to conclude that there is some
population correlation between the variables. In other words, we can use the value of r to determine ifp0. We do this by comparing the value Ir to an entry in the
correlation table. The value of a in the table gives us the prebability of concluding that pO when, in fact, and there is no population correlation. We have two choices
for a a 0.05 or a 0.01.
Cal Valas fer Coma Cdet
00s 00
0.0
1.00
100
13
23
041
ass
095
099
14
0.66
24
040
I5
044
25
092
16
050
061
26
a50
0.75
17
048
0.1
27
049
071
OAS
18
047
0.59
20
037
04
067
19
046
29
0.37
047
063
076
20
044
a56
30
0.56
046
0.60
0.75
21
043
055
12
071
22
0.42
054
Expert Solution
This question has been solved!
Explore an expertly crafted, step-by-step solution for a thorough understanding of key concepts.

This is a popular solution!

Trending now
This is a popular solution!

Step by step
Solved in 3 steps

Recommended textbooks for you
MATLAB: An Introduction with Applications
Statistics
ISBN:
9781119256830
Author:
Amos Gilat
Publisher:
John Wiley & Sons Inc

Probability and Statistics for Engineering and th…
Statistics
ISBN:
9781305251809
Author:
Jay L. Devore
Publisher:
Cengage Learning

Statistics for The Behavioral Sciences (MindTap C…
Statistics
ISBN:
9781305504912
Author:
Frederick J Gravetter, Larry B. Wallnau
Publisher:
Cengage Learning
MATLAB: An Introduction with Applications
Statistics
ISBN:
9781119256830
Author:
Amos Gilat
Publisher:
John Wiley & Sons Inc
Probability and Statistics for Engineering and th…
Statistics
ISBN:
9781305251809
Author:
Jay L. Devore
Publisher:
Cengage Learning
Statistics for The Behavioral Sciences (MindTap C…
Statistics
ISBN:
9781305504912
Author:
Frederick J Gravetter, Larry B. Wallnau
Publisher:
Cengage Learning

Elementary Statistics: Picturing the World (7th E…
Statistics
ISBN:
9780134683416
Author:
Ron Larson, Betsy Farber
Publisher:
PEARSON

The Basic Practice of Statistics
Statistics
ISBN:
9781319042578
Author:
David S. Moore, William I. Notz, Michael A. Fligner
Publisher:
W. H. Freeman

Introduction to the Practice of Statistics
Statistics
ISBN:
9781319013387
Author:
David S. Moore, George P. McCabe, Bruce A. Craig
Publisher:
W. H. Freeman