Looking at the following residual plot, what can you conclude Residuals vs Fitted o10 o 08 1430 590 0.0 0.5 1.0 1.5 2.0 2.5 3.0 The residual standard deviation is not constant for all values of X O There is no linear regression assumption violation A quadratic effect seems to be present Residuals -8 -4 9 0 2 4
Looking at the following residual plot, what can you conclude Residuals vs Fitted o10 o 08 1430 590 0.0 0.5 1.0 1.5 2.0 2.5 3.0 The residual standard deviation is not constant for all values of X O There is no linear regression assumption violation A quadratic effect seems to be present Residuals -8 -4 9 0 2 4

Glencoe Algebra 1, Student Edition, 9780079039897, 0079039898, 2018
18th Edition
ISBN:9780079039897
Author:Carter
Publisher:Carter
Chapter10: Statistics
Section: Chapter Questions
Problem 22SGR

Related questions
Question
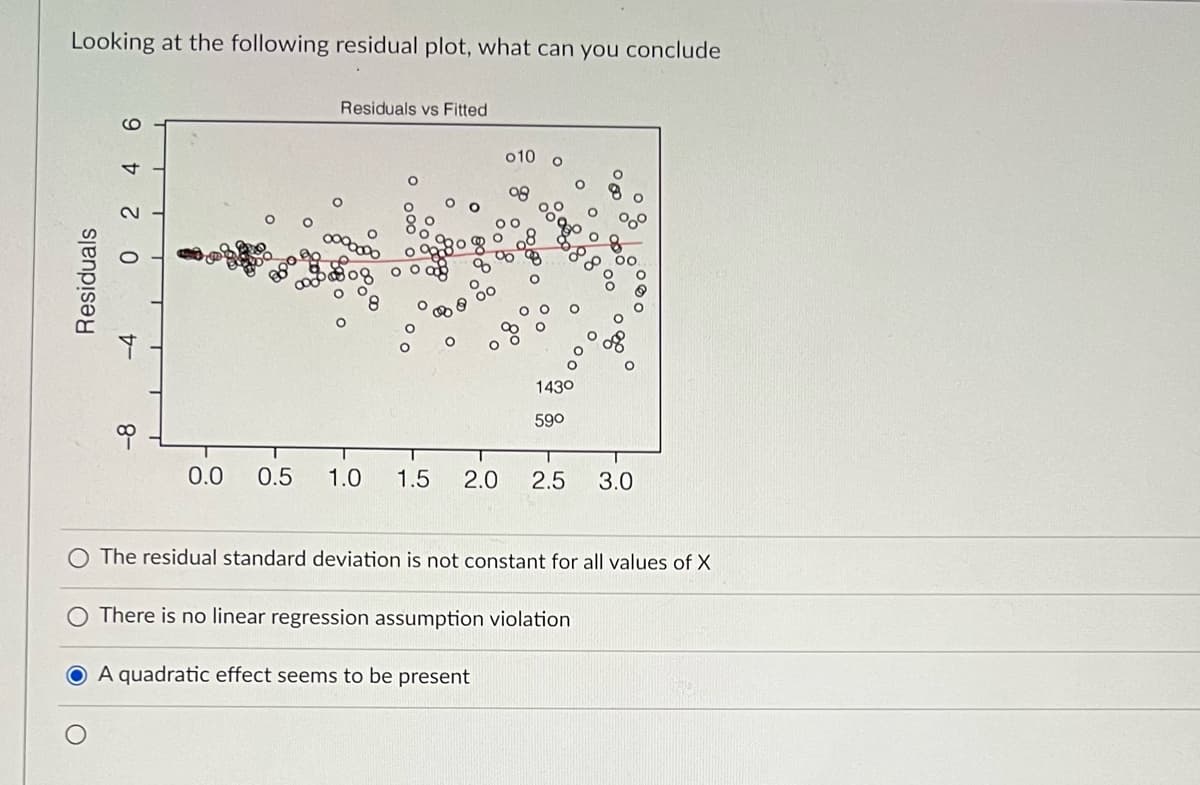
Transcribed Image Text:Looking at the following residual plot, what can you conclude
Residuals vs Fitted
o10
1430
590
0.0
0.5
1.0
1.5
2.0
2.5
3.0
The residual standard deviation is not constant for all values of X
O There is no linear regression assumption violation
A quadratic effect seems to be present
Expert Solution
This question has been solved!
Explore an expertly crafted, step-by-step solution for a thorough understanding of key concepts.

Step by step
Solved in 2 steps

Recommended textbooks for you
Glencoe Algebra 1, Student Edition, 9780079039897…
Algebra
ISBN:
9780079039897
Author:
Carter
Publisher:
McGraw Hill
Glencoe Algebra 1, Student Edition, 9780079039897…
Algebra
ISBN:
9780079039897
Author:
Carter
Publisher:
McGraw Hill