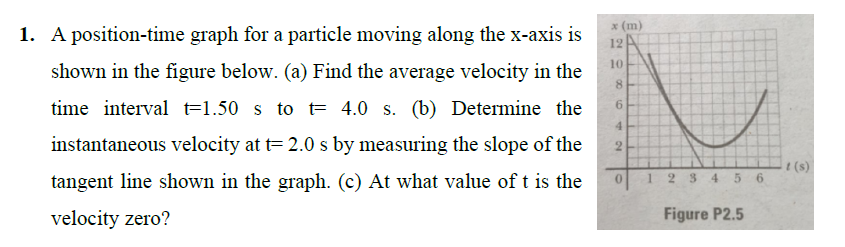
* (m) 1. A position-time graph for a particle moving along the x-axis is 12 10 shown in the figure below. (a) Find the average velocity in the 8. time interval =1.50 s to t= 4.0 s. (b) Determine the 4. instantaneous velocity at t= 2.0 s by measuring the slope of the I (s) 23 456 tangent line shown in the graph. (c) At what value of t is the velocity zero? Figure P2.5
* (m) 1. A position-time graph for a particle moving along the x-axis is 12 10 shown in the figure below. (a) Find the average velocity in the 8. time interval =1.50 s to t= 4.0 s. (b) Determine the 4. instantaneous velocity at t= 2.0 s by measuring the slope of the I (s) 23 456 tangent line shown in the graph. (c) At what value of t is the velocity zero? Figure P2.5

Physics for Scientists and Engineers: Foundations and Connections
1st Edition
ISBN:9781133939146
Author:Katz, Debora M.
Publisher:Katz, Debora M.
Chapter2: One Dimensional Motion
Section: Chapter Questions
Problem 44PQ

Related questions

Question
Please solve and explain the solution too. Thank you very much!
Transcribed Image Text:x (m)
1. A position-time graph for a particle moving along the x-axis is
12
10
shown in the figure below. (a) Find the average velocity in the
8.
time interval t=1.50 s to t= 4.0 s. (b) Determine the
6.
4.
instantaneous velocity at t= 2.0 s by measuring the slope of the
t(s)
tangent line shown in the graph. (c) At what value of t is the
12345 6
velocity zero?
Figure P2.5
Expert Solution
This question has been solved!
Explore an expertly crafted, step-by-step solution for a thorough understanding of key concepts.

This is a popular solution!

Trending now
This is a popular solution!

Step by step
Solved in 3 steps with 3 images

Knowledge Booster


Learn more about
Need a deep-dive on the concept behind this application? Look no further. Learn more about this topic, physics and related others by exploring similar questions and additional content below.Recommended textbooks for you
Physics for Scientists and Engineers: Foundations…
Physics
ISBN:
9781133939146
Author:
Katz, Debora M.
Publisher:
Cengage Learning
Physics for Scientists and Engineers: Foundations…
Physics
ISBN:
9781133939146
Author:
Katz, Debora M.
Publisher:
Cengage Learning