Macro Worksheet to be collected. Make a copy for yourself to go over in class Assume there are 2 states New York (NY) and Minnesota (MN). NY with a Marginal propensity to consume (MPC) of 90% and MN with a Marginal Propensity to save (MPS) of 30%. If both states have the same minimum level (or autonomous) consumption) of 2,500 1. a) Demonstrate and explain the income expenditure model for Minnesota and New York on separate graphs with disposable income ranging from 0 to $10,000 in $2,000 increments. b) Compare the minimum income levels where savings begins for NY and MN. c) How does the difference in MPC affect the economies for each state in the steady state? d) How is this relevant to the economic issue of today about wealth inequality, specifically, If two individuals have 2 different MPC? Demonstrate and explain. Hint Formula from Module C a MPC* Yd where Yd is disposable income. Aggregate Demand and Aggregate Supply Method 1) Starting Position will be given 2) Shock Demand or Supply 3) Positive or Negative Shift of Demand or Supply 4) Ouput gapist recessionary or inflationary 5) Demonstrate and explain effects of initial shock on GDP and Price level 6) In the long run, without policy Demonstrate and explain the market response and why. what will happen to GDP and Price Level
Macro Worksheet to be collected. Make a copy for yourself to go over in class Assume there are 2 states New York (NY) and Minnesota (MN). NY with a Marginal propensity to consume (MPC) of 90% and MN with a Marginal Propensity to save (MPS) of 30%. If both states have the same minimum level (or autonomous) consumption) of 2,500 1. a) Demonstrate and explain the income expenditure model for Minnesota and New York on separate graphs with disposable income ranging from 0 to $10,000 in $2,000 increments. b) Compare the minimum income levels where savings begins for NY and MN. c) How does the difference in MPC affect the economies for each state in the steady state? d) How is this relevant to the economic issue of today about wealth inequality, specifically, If two individuals have 2 different MPC? Demonstrate and explain. Hint Formula from Module C a MPC* Yd where Yd is disposable income. Aggregate Demand and Aggregate Supply Method 1) Starting Position will be given 2) Shock Demand or Supply 3) Positive or Negative Shift of Demand or Supply 4) Ouput gapist recessionary or inflationary 5) Demonstrate and explain effects of initial shock on GDP and Price level 6) In the long run, without policy Demonstrate and explain the market response and why. what will happen to GDP and Price Level

Chapter18: The Keynesian Model
Section: Chapter Questions
Problem 9SQP

Related questions
Question
Hello, I sent this assignment an the last option could not be solved. Can you help me with letter D of assingment 1.
Thank you
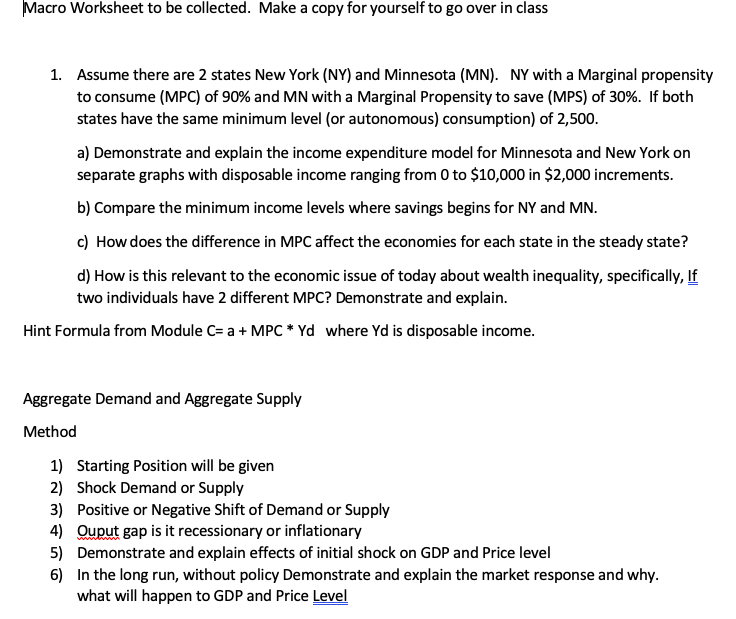
Transcribed Image Text:Macro Worksheet to be collected. Make a copy for yourself to go over in class
Assume there are 2 states New York (NY) and Minnesota (MN). NY with a Marginal propensity
to consume (MPC) of 90% and MN with a Marginal Propensity to save (MPS) of 30%. If both
states have the same minimum level (or autonomous) consumption) of 2,500
1.
a) Demonstrate and explain the income expenditure model for Minnesota and New York on
separate graphs with disposable income ranging from 0 to $10,000 in $2,000 increments.
b) Compare the minimum income levels where savings begins for NY and MN.
c) How does the difference in MPC affect the economies for each state in the steady state?
d) How is this relevant to the economic issue of today about wealth inequality, specifically, If
two individuals have 2 different MPC? Demonstrate and explain.
Hint Formula from Module C a MPC* Yd where Yd is disposable income.
Aggregate Demand and Aggregate Supply
Method
1) Starting Position will be given
2) Shock Demand or Supply
3) Positive or Negative Shift of Demand or Supply
4) Ouput gapist recessionary or inflationary
5) Demonstrate and explain effects of initial shock on GDP and Price level
6) In the long run, without policy Demonstrate and explain the market response and why.
what will happen to GDP and Price Level
Expert Solution
This question has been solved!
Explore an expertly crafted, step-by-step solution for a thorough understanding of key concepts.

This is a popular solution!

Trending now
This is a popular solution!

Step by step
Solved in 3 steps

Knowledge Booster


Learn more about
Need a deep-dive on the concept behind this application? Look no further. Learn more about this topic, economics and related others by exploring similar questions and additional content below.Recommended textbooks for you


Macroeconomics: Principles and Policy (MindTap Co…
Economics
ISBN:
9781305280601
Author:
William J. Baumol, Alan S. Blinder
Publisher:
Cengage Learning
