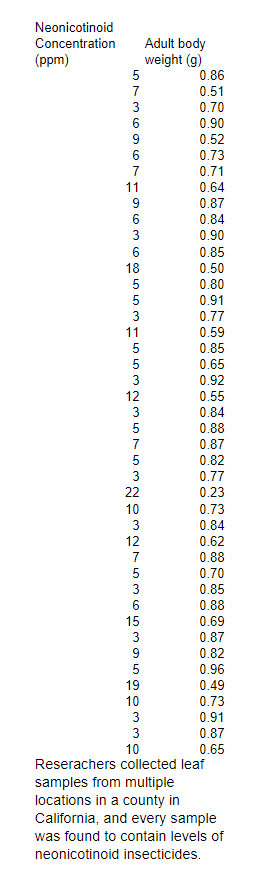
Make a graph in Excel using the data ( the image ) This data represents results from a fictional study comparing bee body weight to insecticide exposure. a. Tittle b. The graph can be any style or format but must display a relationship between the independent (x axis) and dependent (y axis) variables. c. Both axis of the graph must be correctly labeled, including correct units, and represent the independent and dependent variables. d. The graph must contain a trendline with a trendline equation and R2 value


Enzyme kinetics
In biochemistry, enzymes are proteins that act as biological catalysts. Catalysis is the addition of a catalyst to a chemical reaction to speed up the pace of the reaction. Catalysis can be categorized as either homogeneous or heterogeneous, depending on whether the catalysts are distributed in the same phase as that of the reactants. Enzymes are an essential part of the cell because, without them, many organic processes would slow down and thus will affect the processes that are important for cell survival and sustenance.
Regulation of Enzymes
A substance that acts as a catalyst to regulate the reaction rate in the living organism's metabolic pathways without itself getting altered is an enzyme. Most of the biological reactions and metabolic pathways in the living systems are carried out by enzymes. They are specific for their works and work in particular conditions. It maintains the best possible rate of reaction in the most stable state. The enzymes have distinct properties as they can proceed with the reaction in any direction, their particular binding sites, pH specificity, temperature specificity required in very few amounts.
Make a graph in Excel using the data ( the image ) This data represents results from a fictional study comparing bee body weight to insecticide exposure.
a. Tittle
b. The graph can be any style or format but must display a relationship between the independent (x axis) and dependent (y axis) variables.
c. Both axis of the graph must be correctly labeled, including correct units, and
represent the independent and dependent variables.
d. The graph must contain a trendline with a trendline equation and R2 value


Trending now
This is a popular solution!

Step by step
Solved in 3 steps with 1 images