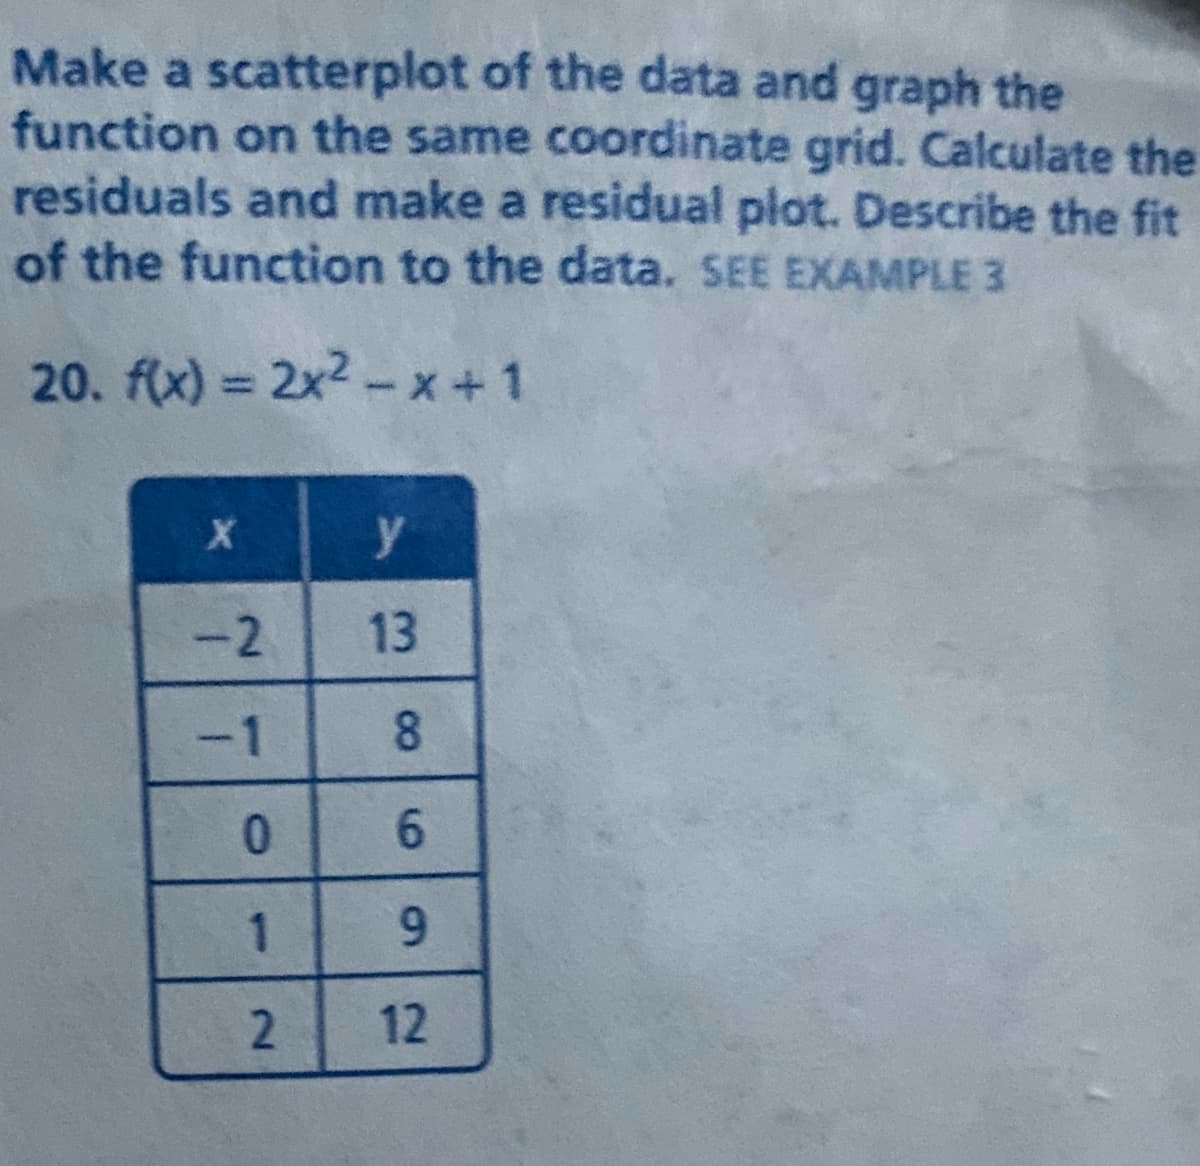
Make a scatterplot of the data and graph the function on the same coordinate grid. Calculate th residuals and make a residual plot. Describe the fit of the function to the data. SEE EXAMPLE 3 20. f(x) = 2x2-x+1 %3D


Q: lan was asked to simplify the following exponential expression: lan is having trouble finding the co...
A: Given query is to simplify the expression.
Q: During which interval is the following function increasing at the greatest average rate? -4 -2 O(- 4...
A: Here we have given a function. We have to find in which interval the function is increasing at great...
Q: - Which equation represents a rational function? A y=x x = 0 B y=x2 B y=x -> Cy= c y=%= -> <-
A:
Q: The rule for the number of fish in a home aquarium is 1 gallon of water for each inch of fish length...
A: lenght of fish A and fish B are:-
Q: -5 -4 -3 -2-1 it 12 Use the graph above to find the intervals on which the function is: Increasing D...
A:
Q: For what values ofn will the set {(1,3),(2,5),(n– 1,1),(n,7),(n+ 1,0) represent a function? A neR B ...
A:
Q: Consider the following linear system: + 2x2 + Y1 3x2 + 4x3 Y2 2x1 + 4.x2 + Y3 which in matrix form i...
A: The detailed solution is given below Thank you
Q: Read each item carefully. Write the letter of the correct answer on the blank before each number. 1....
A: Note:- according to the company policy we can attempt ?️ only three subpart of a question so please ...
Q: %3D 1. Given f(x) = k(x – 3), find the value of k if f-1(5) = 2. %3D
A: Given that fx=kx-3To find :value of k if f-15=2Solution:if we find inverse of function then intercha...
Q: Question 6 Give an example of a nonzero 2x3 matrix A and a nonzero 3x2 matrix B. Use your chosen A a...
A: Question 6Give an example of a nonzero 2x3 matrix A and a nonzero 3x2 matrix B. Use your chosen Aand...
Q: Suppose that the functions s and i are defined for all real Español bers x as follows. (x) =x-4 t(x)...
A:
Q: In circle C with m∠BCD=46 and BC=3 units, find the length of arc BD. Round to the nearest hundredth.
A: This question can be solved by using the formula Length of arc of circle=2πrθ360
Q: 3 = 7 4 2x
A:
Q: 3.) Solve the system of simultaneous equations using Gauss-Jordan method 20х — 9х2 + 15х33 354 - 9x1...
A: Given :20x1-9x2+15x3=354-9x1+16x2-5x3=-27515x1-5x2+18x3=307
Q: Function #1 f(x) Function #2 g(x) 3 g(x) = 2vx-1 + 3 -2 -1 -1 -2 -3 -4 -5 Which comparison of the tw...
A:
Q: 73 3.13 4 +55X0.41 Vis
A: Simplification
Q: An equation of the straight line normal to surface x2 - y3 + z = 8 at the point P(2, -1, 3) on the s...
A:
Q: 3. Consider the straight line æ + y = 1 and the family of straight lines that pass through the origi...
A:
Q: evaluate the equation step by step (find L) 4log L=log(407.55
A: 4logL=log(407.55)
Q: 2x + 5y < 20 2x + 2y < 14 25+ 24 23 VI VI AL AI
A: Please refer to the image below
Q: Given the graphs shown below, determine which graph is Hamiltonian and for such graph, find a Hamilt...
A:
Q: Solve the quadratic equation 2x2-12x+8=3, rounding to the nearest hundreth.
A:
Q: Lyka is raising a farm of hogs and chickens. With these animals he is raising, the leg count is 80 w...
A: We can find the answer as below.
Q: ractice what you learned in the previous activity by answering these questions. uppose $2700 is depo...
A: Given query is to find the amount after 10 years.
Q: Make a conjecturel Is 2X< 2 always true? If not, provide a counter-example, Use the paperclip button...
A:
Q: A) Sketch the graph indicating maxima, minima, asymptotes and inflection points and find the interva...
A: Que : Sketch the graph inflecting maxima, minina , asymptote and inflection points and find the inte...
Q: The equation N = 105, 411e0.017t models the population of a city t years after its last census. What...
A:
Q: 3. Let V = R" be the real vector space that is spanned by {e1,…, En}. For each 1 <r < n let V, = Spa...
A:
Q: on of the sample means () as size (n) increases? decreases ncreases hing happens to ;
A: We will check the statement.
Q: Practice Graph each on a coordinate plane: 1) y-12 3) y<-½x + 4
A:
Q: x is equal to -3y. O True O False
A:
Q: Use the graph of f(x) to solve f(x) = 0 f(x)
A: Given query is to the factors of the expression.
Q: aph: Number of Tiles
A: Here is the solution
Q: Which of the following are one-to-one functions? OR = {(– 5, 0), (2, 3), (6, 5), (8, 7), (11, 10), (...
A:
Q: Let a² a³ a A = | a? a a a? a a) Find a such that det(A) = 0. b) For which values of a does the line...
A:
Q: Solve the system of equations. y 9x y=2x+56 y D0 %3D
A: Given,y=9x ...........1y=2x+56 ..........2Put equation 1 in equat...
Q: Read each item carefully. Write the letter of the correct answer on the blank before each number. _1...
A:
Q: Jon Deposits $7,050 into an account paying 5% annual interest compounded quarterly and Sara deposits...
A:
Q: Suppose that R(x) is a polynomial of degree 9 whose coefficients are real numbers. Also, suppose tha...
A:
Q: Use the change of base fO + to evaluate log:(47) to two decimal places and type your answer in the s...
A: Given: log8(47)
Q: inheritance of $15,000 is invested at a rate of 3.2% compounded continuously What is the value of th...
A:
Q: ux+ h) – v(x) , Given that (x) = 2x² – 5x +2 which of the following is equivalent to (A) 2h+4x - 5 B...
A: Basic functions problem
Q: I 2x x 2x is equal to 3y 3y 3y 3y O True O False
A: Here, we need to verify if Now, x3y+2x3y-x3yGroup like terms=x3y-x3y+2x3yAdd simila...
Q: Find the value (A+Bi form) of the following: (1 + V3i)43 243
A: NOTE: Refresh your page if you can't see any equations. . now consider only here we have
Q: Reduce the given rational expression below and list any values which are excluded from the domain of...
A: The given expression, 9x2-32x-65x2-25
Q: Set A: {(3, 4), (4, 5), (5, 6), (6, 7), (7, 8)} Set B: {(2, 2), (2, -2), (3, 3), (3, -3), (4, 4), ...
A:
Q: Which of the following is an equivalent expression for log, 24 ? A log2 6 – log2 4 B log, 20 + log, ...
A:
Q: Which of the following pairs of functions are inverses of one another? A y= 2 - X and y= x2 ®y-3x-4 ...
A: Check out which of the pairs of functions are inverse of one another.
Q: Write the ratio of the first measurement to the second measurement. Compare in inches. 3 feet to 41 ...
A: topic- ratios 1 feet= 12 inches
Q: Write a sentence to represent each question 1.3+4x 2. 15x-8 3. a•a•a=a³
A: As according to our policy we are allowed to do maximum three sub parts of the equation. Kindly repo...


Trending now
This is a popular solution!

Step by step
Solved in 2 steps with 3 images

- A manager wishes to predict the annual cost (y) of an automobile based on the number of miles (x) driven. The following model was developed: y = 1,550 + 0.36x. If a car is driven 15,000 miles, the predicted cost is ____________.A Filipino analyst used regression analysis between $ sales (y) and $ advertising (x) across all the branches of a major international corporation. He obtained the following regression function. y = 6000 + 7.5x If the advertising budgets of one the of branches of the corporation is $12,250, then what will be the predicted sales?Find the average rate of chage f(x)=3x4/3 [1,8]
- Which of the following is appropriate advice given the value t in the profit model is negative?use the tables on the next page, whichgive a set of input values x and the corresponding outputsy that satisfy a function. a. Would you say that a linear function could beused to model the data? Explain.b. Write the equation of the linear function that fitsthe data.A real estate agent finds the following regression line for predicting the price of a house (y), in thousands of dollars, from the square footage (x). y = 160.2 + 0.09xUse this equation to predict the price of a 2,300 sq. foot house.
- A cyclist is tracking weekly mileage while training for a race. The table models the number of miles, y, for a given week, x. Which type of model would best fit the data, and why?The naval base would like to model the projected percentage increase y in fleet effectiveness by the end of the decade as a function of the cost x of modifying the fleet. A first proposal is the quadratic model E(y) = β0 + β1x + β2x2 Fit the model to the data, then construct a residual plot versus x. Do you detect any trends? Any outliers?The regression in DESMOS using y₁ ~ Ax₁² + Bx₁ + C would try to find the best fit for the x₁/y₁ data table to what kind of function? A). Linear B). Absolute Value C). Quadratic
- An apple orchard yields 20 bushels of apples per tree when there are 75 trees per acre. For each additional tree per acre, it is estimated that yield will decrease by 3 bushels per tree. How many trees should be planted per acre to maximize the yield? Round to the nearest tree.As OHaganBooks.com has grown in popularity, the sales manager has been monitoring book sales as a function of the website traffic (measured in thousands of visits per day) and has obtained the following model s(x) = 1.65x if 0 ≤ x ≤ 100 1.85x − 20 if 100 < x ≤ 250, where s(x) is the average number of books sold in a day in which there are x thousand visitors. (a) On average, how many books per day does the model predict that OHaganBooks.com will sell when it has 60,000 visits in a day? books On average, how many books per day does the model predict that OHaganBooks.com will sell when it has 100,000 visits in a day? books On average, how many books per day does the model predict that OHaganBooks.com will sell when it has 160,000 visits in a day? books (b) What does the coefficient 1.85 tell you about book sales? The coefficient 1.85 is the intercept of the first formula, measured in books sold per thousand visitors. Thus, if there were 0…The bar graph on the right shows the average cost of room and board at four-year public and private colleges for four selected years from 2011 through 2017. The data can be modeled by f(x)=966x+3434 and g(x)=3852e0.132x in which f(x) and g(x) represent the average cost of room and board at public four-year colleges in the school year ending x years after 2010. Use these functions to complete parts (a) through (c) below. A.The average cost in 2017 was $______.