Make an appropriate graph of the distribution of the data, and describe the distribution
Make an appropriate graph of the distribution of the data, and describe the distribution

Glencoe Algebra 1, Student Edition, 9780079039897, 0079039898, 2018
18th Edition
ISBN:9780079039897
Author:Carter
Publisher:Carter
Chapter10: Statistics
Section10.4: Distributions Of Data
Problem 19PFA

Related questions
Question
Make an appropriate graph of the distribution of the data, and describe the distribution.
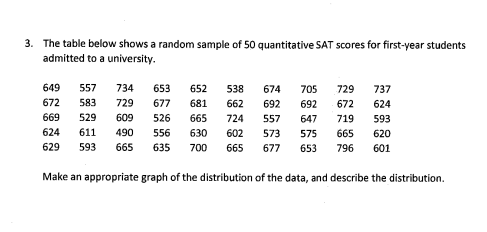
Transcribed Image Text:3. The table below shows a random sample of 50 quantitative SAT scores for first-year students
admitted to a university.
649
557
734
653
652
538
674
705
729
737
672
583
729
677
681
662
692
692
672
624
669
529
609
526
665
724
557
647
719
593
624
611
490
556
630
602
573
575
665
620
629
593
665
635
700
665
677
653
796
601
Make an appropriate graph of the distribution of the data, and describe the distribution.
Expert Solution
This question has been solved!
Explore an expertly crafted, step-by-step solution for a thorough understanding of key concepts.

This is a popular solution!

Trending now
This is a popular solution!

Step by step
Solved in 3 steps with 1 images

Recommended textbooks for you
Glencoe Algebra 1, Student Edition, 9780079039897…
Algebra
ISBN:
9780079039897
Author:
Carter
Publisher:
McGraw Hill
Glencoe Algebra 1, Student Edition, 9780079039897…
Algebra
ISBN:
9780079039897
Author:
Carter
Publisher:
McGraw Hill