Make up an example of a monthly supply schedule for Pizza and graph theimplied supply curve. Provide at least two examples for something that would lead toa shift of the supply curve.


Make up an example of a monthly supply schedule for Pizza and graph theimplied supply curve. Provide at least two examples for something that would lead toa shift of the supply curve.
A supply schedule is indicating the interaction among the value and the amount delivered, that is a direct correlation between them.
The price rise enhances the profitability of pizza and thus raises the amount sold by pizza manufacturers to reach higher gain. As a effect, the delivery plan indicates that there is a strong connection with the pizza cost and the amount of pizza provided.
| Price of pizza | 0 | 2 | 4 | 6 | 8 | 10 |
| Quantity of pizza | 0 | 4 | 8 | 12 | 16 | 20 |
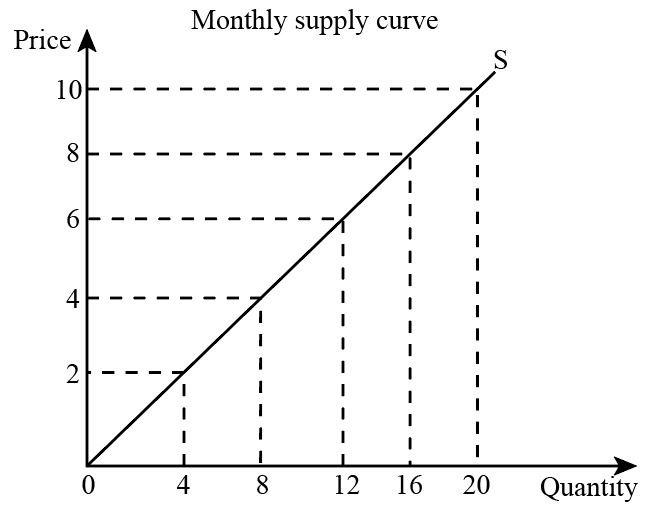
Price is shown on the vertical axis and quantity on horizontal axis. There is a direct correlation between them and supply curve is upward sloping.
A rise in the volume of pizza producers would shift the supply curve. As a consequence of rising prices and the earnings of pizza, pizza producers could expand and cause rightward shift. Even with a rising number of pizza eaters that are driving pizza demand upwards.
If the cost of resources used to make pizza increases, leads to the reduction in supply of pizza and supply curve shift to left.

Step by step
Solved in 3 steps with 1 images


