Make/Model Honda Civic Honda Civic Toyota Prius Toyota Corolla Chevrolet Malibu Chevrolet Malibu Nissan Altima Nissan Altima Ford Escape Ford Escape Saturn Vue Saturn Vue Lexus RX Lexus RX Toyota Highlander Toyota Highlander Class Small Car Small Car Small Car Small Car Midsize Car Midsize Car Midsize Car Midsize Car Small SUV Small SUV Small SUV Small SUV Midsize SUV Midsize SUV Midsize SUV Midsize SUV Type Hybrid Conventional Hybrid Conventional Hybrid Conventional Hybrid Conventional Hybrid Conventional Hybrid Conventional Hybrid Conventional Hybrid Conventional MPG 38 28 32 28 24 33 26 28 20 27 22 23 18 25 18 Rearrange the data for the Anova: Two-Factor With Replication Analysis Hybrid Conventional Small Car Midsize Car Small SUV Midsize SUV After reading these instructions delete all text in this shaded area. Use the XLMiner Analysis ToolPak to conduct your Anova: Two-Factor With Replication analysis. After deleting all text in this shaped area, set the output range in the ToolPak to the top left cell of this area (F14). Your Anova analysis output should fit into this shaded area.
Make/Model Honda Civic Honda Civic Toyota Prius Toyota Corolla Chevrolet Malibu Chevrolet Malibu Nissan Altima Nissan Altima Ford Escape Ford Escape Saturn Vue Saturn Vue Lexus RX Lexus RX Toyota Highlander Toyota Highlander Class Small Car Small Car Small Car Small Car Midsize Car Midsize Car Midsize Car Midsize Car Small SUV Small SUV Small SUV Small SUV Midsize SUV Midsize SUV Midsize SUV Midsize SUV Type Hybrid Conventional Hybrid Conventional Hybrid Conventional Hybrid Conventional Hybrid Conventional Hybrid Conventional Hybrid Conventional Hybrid Conventional MPG 38 28 32 28 24 33 26 28 20 27 22 23 18 25 18 Rearrange the data for the Anova: Two-Factor With Replication Analysis Hybrid Conventional Small Car Midsize Car Small SUV Midsize SUV After reading these instructions delete all text in this shaded area. Use the XLMiner Analysis ToolPak to conduct your Anova: Two-Factor With Replication analysis. After deleting all text in this shaped area, set the output range in the ToolPak to the top left cell of this area (F14). Your Anova analysis output should fit into this shaded area.

Glencoe Algebra 1, Student Edition, 9780079039897, 0079039898, 2018
18th Edition
ISBN:9780079039897
Author:Carter
Publisher:Carter
Chapter10: Statistics
Section10.3: Measures Of Spread
Problem 1GP

Related questions
Question
100%
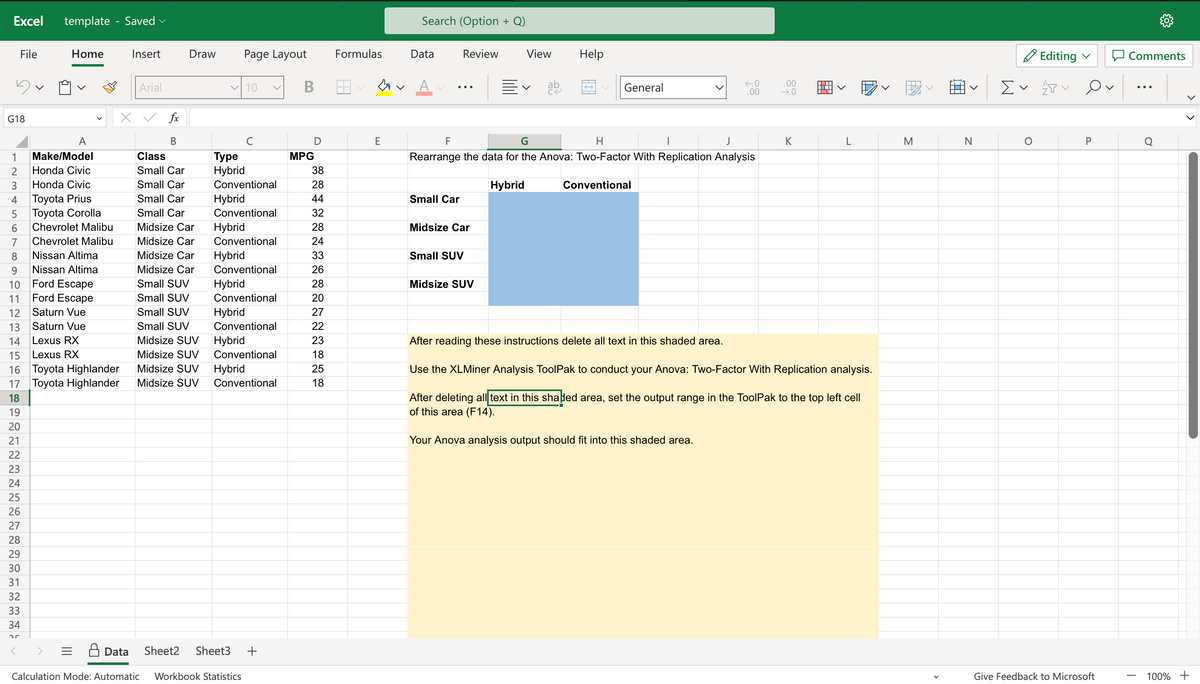
As part of a study designed to compare hybrid and similarly equipped conventional vehicles, a variety of classes of hybrid and all-gas model cars and sport utility vehicles (SUVs) were tested. The data showing the miles-per-gallon rating study obtained for two hybrid small cars, two hybrid midsize cars, two hybrid small SUVs, two hybrid midsize SUVs, and eight similarly equipped conventional models are contained in the Excel Online file below. Construct a spreadsheet to answer the following questions.
Transcribed Image Text:Excel template - Saved
File
5
G18
123456789
Home
A
Make/Model
Honda Civic
Honda Civic
Toyota Prius
Toyota Corolla
Chevrolet Malibu
Chevrolet Malibu
Nissan Altima
Nissan Altima
Ford Escape
Ford Escape
Saturn Vue
Saturn Vue
10
11
12
13
14
Lexus RX
15 Lexus RX
16 Toyota Highlander
17 Toyota Highlander
18
19
20
21
22
23
24
25
26
27
28
29
30
31
32
33
34
25
Insert
Arial
X ✓ fx
B
Draw Page Layout
✓10
с
Class
Type
Small Car Hybrid
Small Car Conventional
Small Car Hybrid
Small Car Conventional
Midsize Car Hybrid
Midsize Car Conventional
Midsize Car Hybrid
Midsize Car Conventional
Small SUV Hybrid
Small SUV Conventional
Small SUV Hybrid
Small SUV Conventional
Midsize SUV Hybrid
Midsize SUV Conventional
Midsize SUV Hybrid
Midsize SUV Conventional
Data Sheet2 Sheet3 +
Calculation Mode: Automatic Workbook Statistics
B
D
MPG
38
28
44
32
28
24
33
26
28
20
27
22
23
18
25
18
Formulas
E
Search (Option + Q)
Data
A
Review
Small Car
Midsize Car
Small SUV
View
Midsize SUV
V
ab
F
G
H
I
Rearrange the data for the Anova: Two-Factor With Replication Analysis
Hybrid
Help
General
←.0
.00
Conventional
.00
→.0
K
L
After reading these instructions delete all text in this shaded area.
Use the XLMiner Analysis ToolPak to conduct your Anova: Two-Factor With Replication analysis.
After deleting all text in this shaped area, set the output range in the ToolPak to the top left cell
of this area (F14).
Your Anova analysis output should fit into this shaded area.
M
N
Editing
Σ ✓ P
O
Ov
P
Give Feedback to Microsoft
Comments
|
Q
100% +
Transcribed Image Text:X
Open spreadsheet
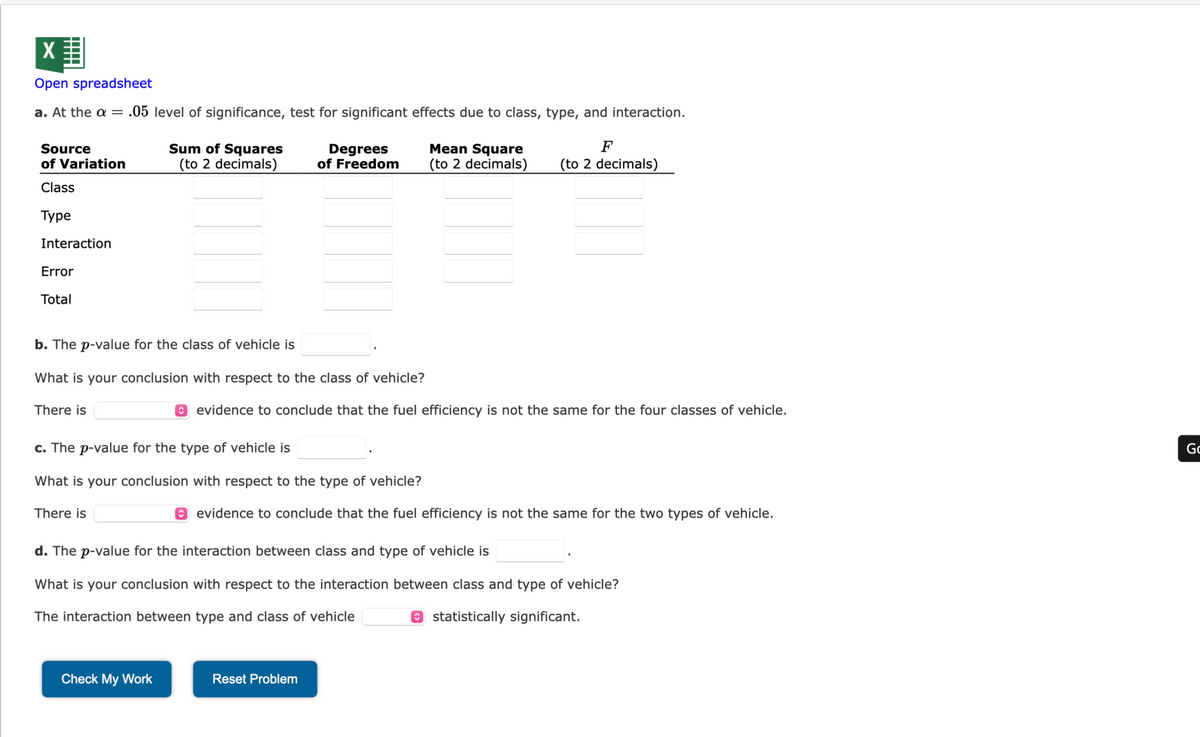
a. At the a = .05 level of significance, test for significant effects due to class, type, and interaction.
Source
of Variation
Class
Туре
Interaction
Error
Total
There is
b. The p-value for the class of vehicle is
What is your conclusion with respect to the class of vehicle?
Sum of Squares
(to 2 decimals)
There is
Degrees
of Freedom
c. The p-value for the type of vehicle is
What is your conclusion with respect to the type of vehicle?
Check My Work
evidence to conclude that the fuel efficiency is not the same for the four classes of vehicle.
Mean Square
F
(to 2 decimals) (to 2 decimals)
evidence to conclude that the fuel efficiency is not the same for the two types of vehicle.
d. The p-value for the interaction between class and type of vehicle is
What is your conclusion with respect to the interaction between class and type of vehicle?
The interaction between type and class of vehicle
statistically significant.
Reset Problem
Go
Expert Solution
This question has been solved!
Explore an expertly crafted, step-by-step solution for a thorough understanding of key concepts.

Step by step
Solved in 3 steps with 10 images

Recommended textbooks for you
Glencoe Algebra 1, Student Edition, 9780079039897…
Algebra
ISBN:
9780079039897
Author:
Carter
Publisher:
McGraw Hill

Big Ideas Math A Bridge To Success Algebra 1: Stu…
Algebra
ISBN:
9781680331141
Author:
HOUGHTON MIFFLIN HARCOURT
Publisher:
Houghton Mifflin Harcourt

Holt Mcdougal Larson Pre-algebra: Student Edition…
Algebra
ISBN:
9780547587776
Author:
HOLT MCDOUGAL
Publisher:
HOLT MCDOUGAL
Glencoe Algebra 1, Student Edition, 9780079039897…
Algebra
ISBN:
9780079039897
Author:
Carter
Publisher:
McGraw Hill
Big Ideas Math A Bridge To Success Algebra 1: Stu…
Algebra
ISBN:
9781680331141
Author:
HOUGHTON MIFFLIN HARCOURT
Publisher:
Houghton Mifflin Harcourt
Holt Mcdougal Larson Pre-algebra: Student Edition…
Algebra
ISBN:
9780547587776
Author:
HOLT MCDOUGAL
Publisher:
HOLT MCDOUGAL