Male BMI Female BMI Given in the table are the BMl statistics for random samples of men and women. Assume that the two samples are independent simple random samples selected from normally distributed populations, and do not assume that the population standard deviations are equal. Use a 0.01 significance level for both parts to test the claim that males and females have the same mean boly mass index (BMI) as follows. 40 40 28.3598 7.478317 26.2407 4.243401 brre What are the null and alternative hypotheses? O A. Ho: H1#42 O B. Ho: H1= H2 ZH > TH :TH ZH < TrH :TH OC. Ho: H12 H2 O D. Ho: H1= #2 H: P1 42 ZH > TrH :TH (Round to three decimal places as needed.) Look in row n-1 and two-tail column alpha of the t-table and change the sign to get the lower critical value: Look in row n-1 and two-tail column alpha of the t-table to get the upper critical value: (Round to three decimal places as needed.) Click to select your answer(s) and then click Check Answer. Check Answer Clear All All parts showing
Male BMI Female BMI Given in the table are the BMl statistics for random samples of men and women. Assume that the two samples are independent simple random samples selected from normally distributed populations, and do not assume that the population standard deviations are equal. Use a 0.01 significance level for both parts to test the claim that males and females have the same mean boly mass index (BMI) as follows. 40 40 28.3598 7.478317 26.2407 4.243401 brre What are the null and alternative hypotheses? O A. Ho: H1#42 O B. Ho: H1= H2 ZH > TH :TH ZH < TrH :TH OC. Ho: H12 H2 O D. Ho: H1= #2 H: P1 42 ZH > TrH :TH (Round to three decimal places as needed.) Look in row n-1 and two-tail column alpha of the t-table and change the sign to get the lower critical value: Look in row n-1 and two-tail column alpha of the t-table to get the upper critical value: (Round to three decimal places as needed.) Click to select your answer(s) and then click Check Answer. Check Answer Clear All All parts showing

Glencoe Algebra 1, Student Edition, 9780079039897, 0079039898, 2018
18th Edition
ISBN:9780079039897
Author:Carter
Publisher:Carter
Chapter10: Statistics
Section10.4: Distributions Of Data
Problem 19PFA

Related questions
Topic Video
Question
Transcribed Image Text:Instructor-created question
Question Help
Male BMI Female BMI
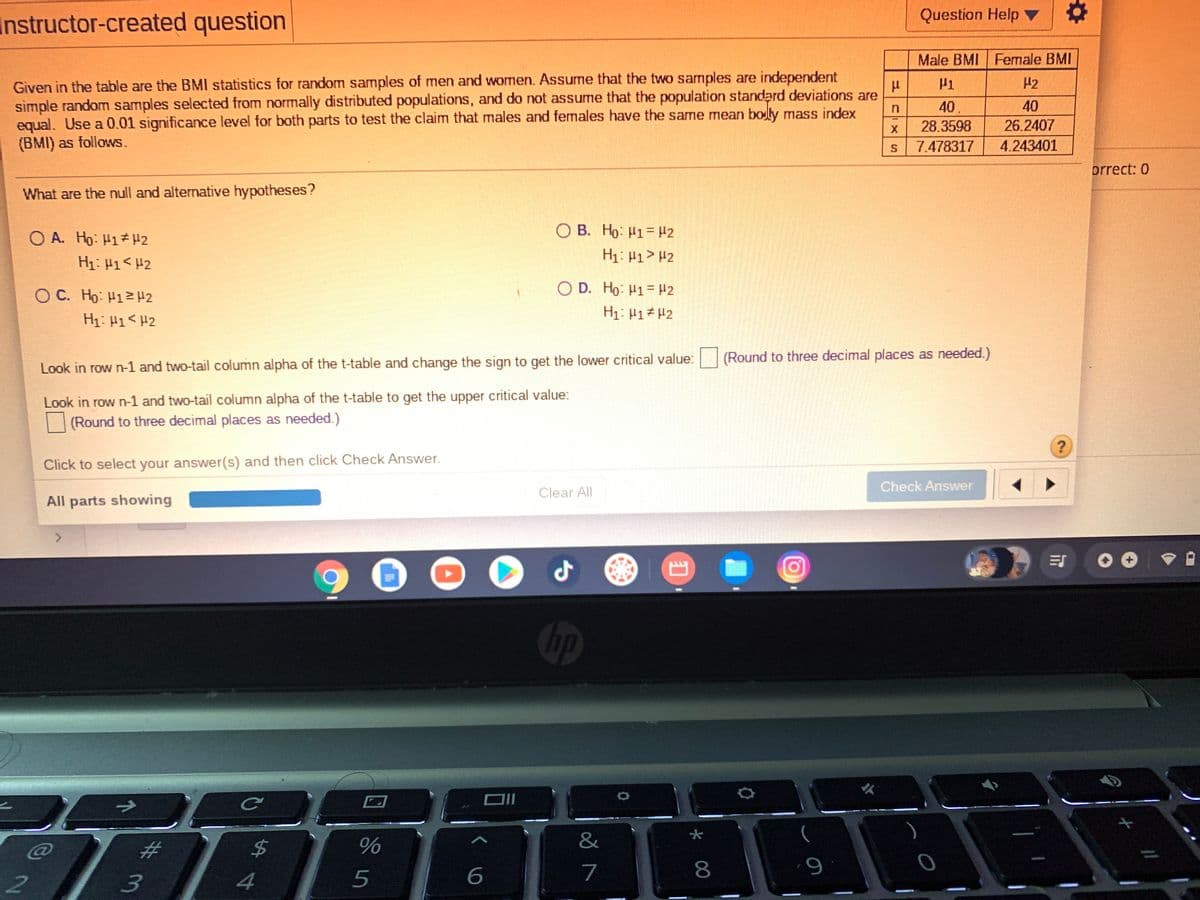
Given in the table are the BMI statistics for random samples of men and women. Assume that the two samples are independent
simple random samples selected from normally distributed populations, and do not assume that the population standard deviations are
equal. Use a 0.01 significance level for both parts to test the claim that males and females have the same mean boly mass index
(BMI) as follows.
H2
40
40
28.3598
26.2407
7.478317
4.243401
prrect: 0
What are the null and alternative hypotheses?
OB. Ho: H1- H2
O A. Ho: H1H2
H1: H1<#2
H1: H1> H2
O C. Ho: H12H2
O D. Ho: H1= #2
H1: H1##2
H1: H1<#2
Look in row n-1 and two-tail column alpha of the t-table and change the sign to get the lower critical value: (Round to three decimal places as needed.)
Look in row n-1 and two-tail column alpha of the t-table to get the upper critical value:
(Round to three decimal places as needed.)
Click to select your answer(s) and then click Check Answer.
Check Answer
Clear All
All parts showing
hp
ロ1
大
%23
24
%
&
4
5
7
8
2.
Transcribed Image Text:Instructor-created question
Question Help ▼
Male BMI Female BMI
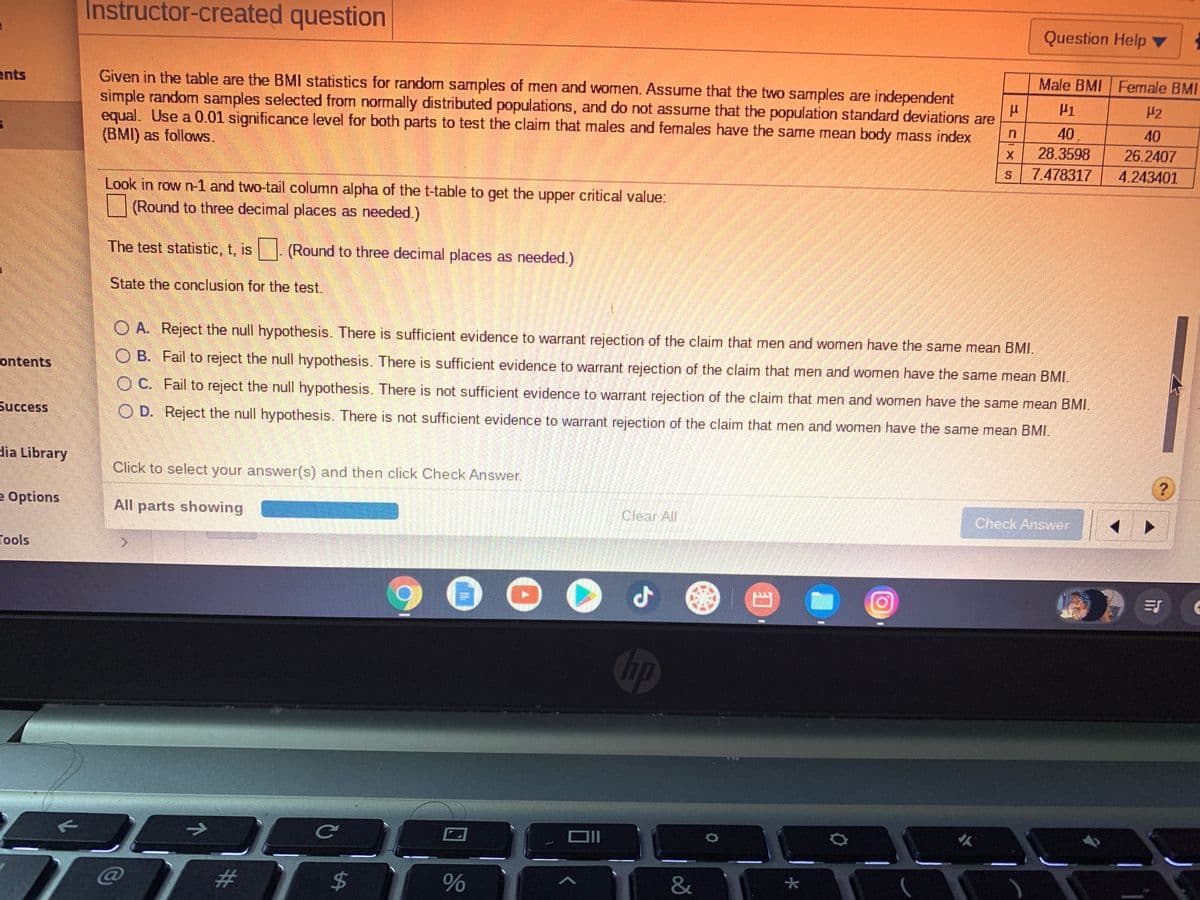
Given in the table are the BMI statistics for random samples of men and women. Assume that the two samples are independent
simple random samples selected from normally distributed populations, and do not assume that the population standard deviations are
equal. Use a 0.01 significance level for both parts to test the claim that males and females have the same mean body mass index
(BMI) as follows.
ents
P1
42
40
AO
40
28.3598
26.2407
7.478317
4.243401
Look in row n-1 and two-tail column alpha of the t-table to get the upper critical value:
(Round to three decimal places as needed.)
The test statistic, t, is
(Round to three decimal places as needed.)
State the conclusion for the test.
O A. Reject the null hypothesis. There is sufficient evidence to warrant rejection of the claim that men and women have the same mean BMI.
O B. Fail to reject the null hypothesis. There is sufficient evidence to warrant rejection of the claim that men and women have the same mean BMI.
ontents
O C. Fail to reject the null hypothesis. There is not sufficient evidence to warrant rejection of the claim that men and women have the same mean BMI.
Success
O D. Reject the null hypothesis. There is not sufficient evidence to warrant rejection of the claim that men and women have the same mean BMI.
dia Library
Click to select your answer(s) and then click Check Answer.
e Options
All parts showing
Clear All
Check Answer
Tools,
bp
II
大
@
%23
&
三
%24
Expert Solution
This question has been solved!
Explore an expertly crafted, step-by-step solution for a thorough understanding of key concepts.

Step by step
Solved in 2 steps with 1 images

Knowledge Booster


Learn more about
Need a deep-dive on the concept behind this application? Look no further. Learn more about this topic, statistics and related others by exploring similar questions and additional content below.Recommended textbooks for you
Glencoe Algebra 1, Student Edition, 9780079039897…
Algebra
ISBN:
9780079039897
Author:
Carter
Publisher:
McGraw Hill
Glencoe Algebra 1, Student Edition, 9780079039897…
Algebra
ISBN:
9780079039897
Author:
Carter
Publisher:
McGraw Hill