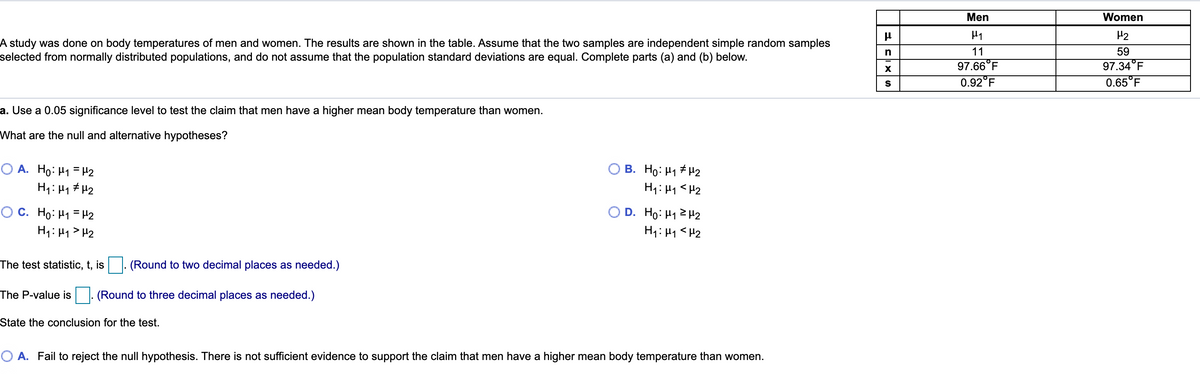
Men Women H2 59 97.34 F 0.65 F A study was done on body temperatures of men and women. The results are shown in the table. Assume that the two samples are independent simple random samples selected from normally distributed populations, and do not assume that the population standard deviations are equal. Complete parts (a) and (b) below. 11 97.66"F 0.92"F n a. Use a 0.05 significance level to test the claim that men have a higher mean body temperature than women. What are the null and alternative hypotheses? O A. Ho: H1 =H2 O B. Ho: H1 H2 Hy: H1

MATLAB: An Introduction with Applications
6th Edition
ISBN:9781119256830
Author:Amos Gilat
Publisher:Amos Gilat
Chapter1: Starting With Matlab
Section: Chapter Questions
Problem 1P
icon
Related questions
Topic Video
Question
Men
Women
H2
A study was done on body temperatures of men and women. The results are shown in the table. Assume that the two samples are independent simple random samples
selected from normally distributed populations, and do not assume that the population standard deviations are equal. Complete parts (a) and (b) below.
n
11
59
97.34°F
0.65°F
97.66°F
0.92°F
a. Use a 0.05 significance level to test the claim that men have a higher mean body temperature than women.
What are the null and alternative hypotheses?
O A. Ho: H1 = H2
H1: H1 # H2
B. Ho: H1 # H2
H1: H1 <H2
D. Ho: H1 2 H2
H1: H1<H2
O C. Ho: H1 = H2
H1: H1 > H2
The test statistic, t, is
(Round to two decimal places as needed.)
The P-value is
(Round to three decimal places as needed.)
State the conclusion for the test.
O A. Fail to reject the null hypothesis. There is not sufficient evidence to support the claim that men have a higher mean body temperature than women.
Transcribed Image Text:Men Women H2 A study was done on body temperatures of men and women. The results are shown in the table. Assume that the two samples are independent simple random samples selected from normally distributed populations, and do not assume that the population standard deviations are equal. Complete parts (a) and (b) below. n 11 59 97.34°F 0.65°F 97.66°F 0.92°F a. Use a 0.05 significance level to test the claim that men have a higher mean body temperature than women. What are the null and alternative hypotheses? O A. Ho: H1 = H2 H1: H1 # H2 B. Ho: H1 # H2 H1: H1 <H2 D. Ho: H1 2 H2 H1: H1<H2 O C. Ho: H1 = H2 H1: H1 > H2 The test statistic, t, is (Round to two decimal places as needed.) The P-value is (Round to three decimal places as needed.) State the conclusion for the test. O A. Fail to reject the null hypothesis. There is not sufficient evidence to support the claim that men have a higher mean body temperature than women.
Men
Women
H2
A study was done on body temperatures of men and women. The results are shown in the table. Assume that the two samples are independent simple random samples
selected from normally distributed populations, and do not assume that the population standard deviations are equal. Complete parts (a) and (b) below.
11
59
97.66°F
97.34°F
0.92°F
0.65°F
S
The P-value is
(Round to three decimal places as needed.)
State the conclusion for the test.
O A. Fail to reject the null hypothesis. There is not sufficient evidence to support the claim that men have a higher mean body temperature than women.
B. Reject the null hypothesis. There is sufficient evidence to support the claim that men have a higher mean body temperature than women.
C. Reject the null hypothesis. There is not sufficient evidence to support the claim that men have a higher mean body temperature than women.
D. Fail to reject the null hypothesis. There is sufficient evidence to support the claim that men have a higher mean body temperature than women.
b. Construct a confidence interval suitable for testing the claim that men have a higher mean body temperature than women.
(Round to three decimal places as needed.)
Does the confidence interval support the conclusion found with the hypothesis test?
because the confidence interval contains
Transcribed Image Text:Men Women H2 A study was done on body temperatures of men and women. The results are shown in the table. Assume that the two samples are independent simple random samples selected from normally distributed populations, and do not assume that the population standard deviations are equal. Complete parts (a) and (b) below. 11 59 97.66°F 97.34°F 0.92°F 0.65°F S The P-value is (Round to three decimal places as needed.) State the conclusion for the test. O A. Fail to reject the null hypothesis. There is not sufficient evidence to support the claim that men have a higher mean body temperature than women. B. Reject the null hypothesis. There is sufficient evidence to support the claim that men have a higher mean body temperature than women. C. Reject the null hypothesis. There is not sufficient evidence to support the claim that men have a higher mean body temperature than women. D. Fail to reject the null hypothesis. There is sufficient evidence to support the claim that men have a higher mean body temperature than women. b. Construct a confidence interval suitable for testing the claim that men have a higher mean body temperature than women. (Round to three decimal places as needed.) Does the confidence interval support the conclusion found with the hypothesis test? because the confidence interval contains
Expert Solution
Step 1

a)

Denote μ1, μ2 as the population mean body temperatures for men and women, respectively.

Step 2

It is needed to check whether men have a higher mean body temperature than women.

The null and alternative hypotheses are as follows:

H0: μ1 = μ2, Vs. H1: μ1 > μ2.

Correct option is C.

Consider that n1 = 11, 1 = 97.66 and s1 = 0.92, are the sample size, sample mean and sample standard deviation of body temperatures for men, respectively.

Consider that n2 = 59, 2 = 97.34 and s2 = 0.65 are the sample size, sample mean and sample standard deviation of body temperatures for women, respectively.

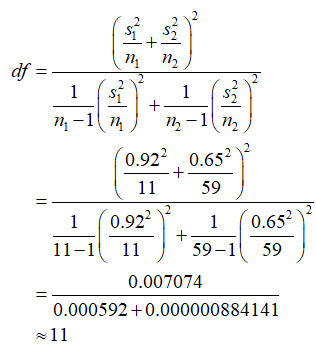
The two-sample t test with unequal variance (Welch’s t-test) is to be conducted, at level of significance α = 0.05.

The degrees of freedom for the test is,

Statistics homework question answer, step 2, image 1

The test statistic is found as follows:

Statistics homework question answer, step 2, image 2

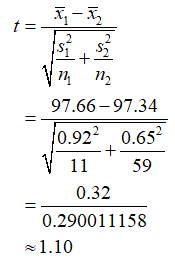
The test statistic is 1.10.

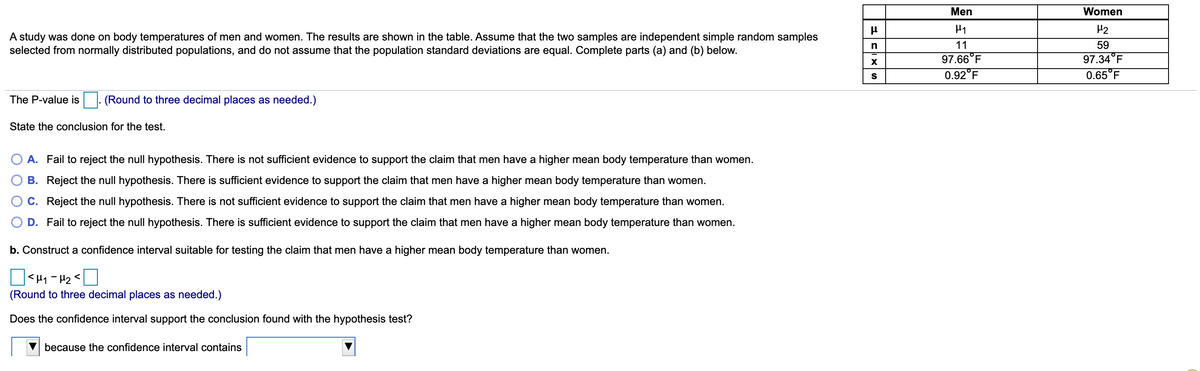
Using Excel formulae: =T.DIST.RT(1.10,11), the P-value is 0.147.

Decision rule:

If the P-value is less than or equal to the level of significance, then reject the null hypothesis. Otherwise fail to reject the null hypothesis.

Since the P-value (0.147) is greater than the level of significance (0.05), fail to reject H0.

Hence, there is not enough evidence to claim that, the men have a higher mean body temperature than women, at 5% level of significance.

Correct option is A.

steps

Step by step

Solved in 3 steps with 4 images

Blurred answer
Knowledge Booster
Hypothesis Tests and Confidence Intervals for Means
Learn more about
Need a deep-dive on the concept behind this application? Look no further. Learn more about this topic, statistics and related others by exploring similar questions and additional content below.
Recommended textbooks for you
MATLAB: An Introduction with Applications
Statistics
ISBN:
9781119256830
Author:
Amos Gilat
Publisher:
John Wiley & Sons Inc
Probability and Statistics for Engineering and th…
Statistics
ISBN:
9781305251809
Author:
Jay L. Devore
Publisher:
Cengage Learning
Statistics for The Behavioral Sciences (MindTap C…
Statistics
ISBN:
9781305504912
Author:
Frederick J Gravetter, Larry B. Wallnau
Publisher:
Cengage Learning
Elementary Statistics: Picturing the World (7th E…
Statistics
ISBN:
9780134683416
Author:
Ron Larson, Betsy Farber
Publisher:
PEARSON
The Basic Practice of Statistics
Statistics
ISBN:
9781319042578
Author:
David S. Moore, William I. Notz, Michael A. Fligner
Publisher:
W. H. Freeman
Introduction to the Practice of Statistics
Statistics
ISBN:
9781319013387
Author:
David S. Moore, George P. McCabe, Bruce A. Craig
Publisher:
W. H. Freeman