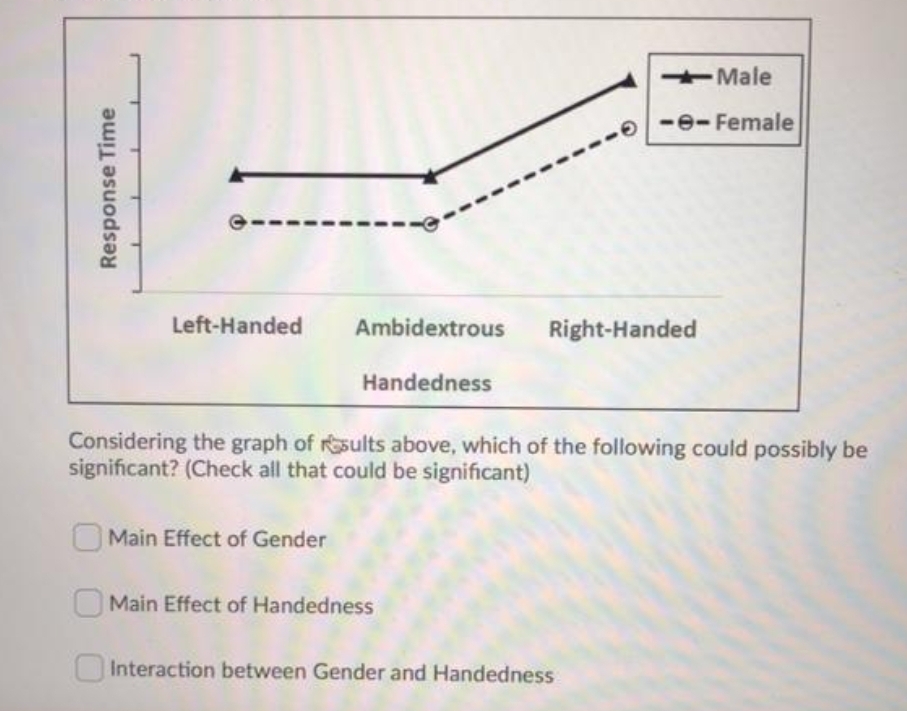
Male -e-Female Left-Handed Ambidextrous Right-Handed Handedness Considering the graph of rsults above, which of the following could possibly B significant? (Check all that could be significant) O Main Effect of Gender Main Effect of Handedness Interaction between Gender and Handedness Response Time


Q: A process manufactures plastic tapes in batches of 50 units (tapes). The inspection records of the…
A:
Q: Which scatter plot shows a nonlinear association between two variables?
A: Given: Graphs of scatter plots are given in above figure. A scatter plot in which the points do…
Q: A warden is motivated to reduce to aggressive interactions between inmates that sometimes occur in…
A: Given information: The data represents the values of the variables Aggression and Hobby time.
Q: Scenario: A sports psychologist studied the effect of a motivational program on number of injuries…
A: Every sports contain two values either with motivational program or without motivational program.
Q: People with chronic airflow obstruction are believed to have a limited exercise tolerance. This…
A: The difference is: 1.3, 2.1, 0.2, 1.2, 1.6, 4.4, 1, -4.2, 6.4.
Q: A well-known multinational FMCG produces more than fifty products and sells them in the market. Out…
A: Data is given for weekly sale and average weekly temperature. Product manager observed that, during…
Q: You are interested in studying the relationship between dietary fat intake and pubertal onset. a.…
A: Dietary fat intake and Pubertal onset variable is given to model the data
Q: A two-factor study investigates the effects of self-esteem (low vs. high) and gender (males vs.…
A: (a). Explain the self-esteem by gender interaction: The data represents the effects of self-esteem…
Q: Which graph depicts positive correlation
A:
Q: Why are interaction effects only associated with factorial designs? Examine the following data table…
A:
Q: A well-known multinational FMCG produces more than fifty products and sells them in the market. Out…
A:
Q: he researchers conjectured that high olive oil consumption would be more common among patients…
A: Cancer data is given, Low Medium High Colon Cancer 398 397 430 Rectal…
Q: Blood Pressure and Platelets Given below are the systolic blood pressure measurements (mm Hg) and…
A: Here, the association between systolic blood pressure and blood platelet has to be obtained. Thus,…
Q: 5) The grid below has 30 rows going across and 34 columns going up and down. So, there are a total…
A: Given , 30x34 grid = 1020 square , each square represents 100 people of population .
Q: Fifty-four wild bears were anesthetized, and then their weights and chest sizes were measured and…
A: Here, Fifty-four wild bears were anesthetized, and then their weights and chest sizes were measured…
Q: Heavy Alcohol Consumption Cases Controls Yes 50 50 No 75 150 Based on the brief…
A:
Q: Which of the following are reasons that are potential limitations to a research study? Choose all…
A: A research study is a procedure that plans the research, conducts, analyzes, and interprets the…
Q: Indicate which of the following hypotheses are one or two tailed and if one tailed, , indicate which…
A: Concept: The null hypothesis can be defined as the hypothesis of no difference or equality, while…
Q: Exercise is useful not only in preventing depression, but also as a treatment. The following graphs…
A: Given, exercise and percentage of patients with depression in remission given points are (180,42),…
Q: A warden is motivated to reduce to aggressive interactions between inmates that sometimes occur in…
A: Given information: The data represents the values of the variables Aggression and Hobby time.
Q: Let Factor A have four levels and Factor B have six levels. What is the value of κ for the q-curve…
A:
Q: he authors of a paper describe an experiment to evaluate the effect of using a cell phone on…
A: Given Information: Sample size (n) = 41 Sample mean (x¯) = 530 Sample standard deviation (s) = 70…
Q: he Internet is rapidly becoming an essential source of information about health, nutrition,…
A: Given, Owns a Computer Does Not Own a Computer Total Age: 18-30 378 336 714…
Q: Some researchers believe that consuming fish high in omega-3 fatty acids can help prevent memory…
A:
Q: Which graph depicts no correlation
A: The answer is "D". The picture (A) represents weak positive correlation, (B) represents perfect…
Q: This question is from the textbook and I had raised a request as the graph was not visible in your…
A: a) graphical representation is the geometrical image of a set if data. The best representation of a…
Q: The KidsFeet dataframe contains data collected on 39 fourth grade students in Ann Arbor, MI, in…
A: To plot this scatter plot we need data as given that length has been shown on x axis and y has been…
Q: Product manager was interested in developing a relationship between sales and temperature;…
A: d) Percent variation is the difference between the mean of the independent variable and the…
Q: Determine the statistical relationship between temperature and sale of water and interpret. How much…
A: Data of sales and temperature is given as: Sales 75 77 69 63 79 80 77 70 73…
Q: Researchers are interested to determine if there is a relationship between death anxiety and…
A: Given information: Person Death Anxiety Regionality 1 42 3 2 29 11 3 31 5 4 28 9 5 15 6…
Q: Determine the type of misleading that the graph commit. Choose the best answer. COST OF GAS NATIONAL…
A:
Q: Blood Pressure and Platelets Given below are the systolic blood pressure measurements (mm Hg) and…
A: Here, the association between systolic blood pressure and blood platelet has to be obtained.
Q: A well-known multinational FMCG produces more than fifty products and sells them in the market. Out…
A: (d) Determine the percent variation in sales due to temperature and due to other factors. The…
Q: I am to make an Excel spreadsheet that provides original data organized in a chart, and displays…
A: Given information: Do you drink coffee or another caffeinated simulate before schoolwork If yes…
Q: I am to make an Excel spreadsheet that provides original data organized in a chart, and displays…
A: Here the given data is represented in excel as shown below
Q: Indicate which of the following hypotheses are one or two tailed and if one tailed, indicate which…
A: a. There claim is that it would reduce blood pressure therefore there should be < (less than)…
Q: A well-known multinational FMCG produces more than fifty products and sells them in the market. Out…
A: Note- As per our policy we can answer only the first 3 sub-parts of a question. If you want…
Q: A well-known multinational FMCG produces more than fifty products and sells them in the market. Out…
A: Note: Hi there! Thank you for posting the question. As there are multiple sub parts, according to…
Q: People with chronic airflow obstruction are believed to have a limited exercise tolerance. This…
A: Given Information: Test statistic is given by the formula: Calculation of the test statistic:
Q: Let Factor A have four levels and Factor B have six levels. What is the value of κ for the q-curve…
A:
Q: A well-known multinational FMCG produces more than fifty products and sells them in the market. Out…
A: Solution: sales temperature 75 32 77 36 69 31 63 31 79 34 80 29 77 32 70 35 73…
Q: A warden is motivated to reduce to aggressive interactions between inmates that sometimes occur in…
A: The test for significance of an observed sample correlation is calculated for the sample size less…
Q: business graduate wants to get a job in any one of the top 10 accounting firms. Applying to any of…
A: Hello! As you have posted more than 3 sub parts, we are answering the first 3 sub-parts. In case…
Q: Fifty-four wild bears were anesthetized, and their weights and chest sizes were measured. Results…
A: From the provided information, The hypotheses can be constructed as: H0: ρ = 0 (There is no…
Q: /hich scatterplot shows a strong association etween two variables even though the prrelation…
A:
Q: Working with Large Data Sets High School Completion. As reported by the U.S. Census Bureau in…
A: a)Step-by-step software procedure to draw stem and leaf plot using MINITAB software is as…
Q: A well-known multinational FMCG produces more than fifty products and sells them in the market. Out…
A: Given Observation Sales Temperature 75 32 77 36 69 31 63 31 79 34 80 29 77 32 70…
Q: 6. Does there appear to be a main effect of age? 7. Does there appear to be an interaction between…
A: Given an experiment conducted to test if time of the day affects the memory of younger and older…


Step by step
Solved in 2 steps


- Mercury is a persistent and dispersive environmental contaminantfound in many ecosystems around the world.When released as an industrial by-product, it often finds itsway into aquatic systems where it can have deleteriouseffects on various avian and aquatic species. The accompanyingdata on blood mercury concentration (mg/g) for adultfemales near contaminated rivers in Virginia was read froma graph in the article “Mercury Exposure Effects theReproductive Success of a Free-Living TerrestrialSongbird, the Carolina Wren” (The Auk, 2011: 759–769;this is a publication of the American Ornithologists’ Union)..20 .22 .25 .30 .34 .41 .55 .561.42 1.70 1.83 2.20 2.25 3.07 3.25a. Determine the values of the sample mean and samplemedian and explain why they are different.[Hint: ox1 5 18.55.]b. Determine the value of the 10% trimmed mean andcompare to the mean and median.c. By how much could the observation .20 be increasedwithout impacting the value of the sample median?A) What is the purpose of the “callout bubble” in the bottom right-hand corner of the graph, showing a tiny red square inside the yellow square? Why do you suppose the author felt the need to use a callout bubble? B) Data from this source show that the rate of symptomatic infection with COVID for people who have been vaccinated is about 100 infections per 102,000 vaccinations. As of July 30, 2021, data show that164,000,000 Americans have been fully vaccinated. How many of these vaccinated Americans would be expected to become infected with COVID and display symptoms? C) Data from this source show that the rate of death from COVID for people who have been vaccinated is about 1 death per 102,000 vaccinations. As of July 30, 2021, data show that 164,000,000 Americans have been fully vaccinated. How many of these vaccinated Americans would be expected to die from COVID?A process manufactures plastic tapes in batches of 50 units (tapes). The inspection records of the last 30 batches produced during one week individually by 30 workers of this process revealed the following results: (IMAGE) The production supervisor, will award a prize to the most outstanding worker of the week and in addition a party will be given in his honor. a) Draw a graph of worker vs. % of non-conforming product. b) What is the average quality level of the week obtained by the workers in this process? c) To whom should the award be assigned?Who was the best worker? Who was the worst worker? d) What would you do to improve the results of this process?
- The attached file contains hypothetical data for working this problem. Goodman Corporation’s and Landry Incorporated’s stock prices and dividends, along with the Market Index, are shown in the file. Stock prices are reported for December 31 of each year, and dividends reflect those paid during the year. The market data are adjusted to include dividends. Construct a scatter diagram graph that shows Goodman’s and Landry’ returns on the vertical axis and the Market Index’s returns on the horizontal axis.Mercury is a persistent and dispersive environmental contaminant found in many ecosystems around the world. When released as an industrial by-product, it often finds its way into aquatic systems where it can have deleterious effects on various avian and aquatic species. The accompanying data on blood mercury concentration (µg/g) for adult females near contaminated rivers in a state was read from a graph in an article. 0.20 0.23 0.26 0.30 0.35 0.41 0.54 0.57 1.43 1.70 1.84 2.20 2.24 3.08 3.26 (a) Determine the values of the sample mean and sample median. [Hint: Σxi = 18.61.] (Round your answers to four decimal places.) - x = ? ~ x = ? Explain why they are different. There is heavy positive skewness in the data. They aren't different since the data is symmetric. There are an odd number of data values. There is heavy negative skewness in the data. The sample mean and sample median are never equal. (b) Determine the value of the 10% trimmed mean. (Round your answer to…Mercury is a persistent and dispersive environmental contaminant found in many ecosystems around the world. When released as an industrial by-product, it often finds its way into aquatic systems where it can have deleterious effects on various avian and aquatic species. The accompanying data on blood mercury concentration (µg/g) for adult females near contaminated rivers in a state was read from a graph in an article. 0.20 0.23 0.24 0.30 0.35 0.41 0.54 0.57 1.43 1.70 1.82 2.20 2.24 3.08 3.24 (a) Determine the values of the sample mean and sample median. Hint: xi = 18.55. (Round your answers to four decimal places.) x== Explain why they are different. The sample mean and sample median are never equal.They aren't different since the data is symmetric. There is heavy negative skewness in the data.There are an odd number of data values.There is heavy positive skewness in the data. (b) Determine the value of the 10% trimmed mean.…
- Researchers want to know at the .04 level if children under 10 spend less time watching TV than teens. Under 10 24.8 25 26.8 22 23 Teens 26.7 24 26 24.5 28 1. The graph is (give one answer: L - Left tailed, R - Right tailed, 2 - Two-Tailed) 2. Critical Value (start with negative and separate with a comma if there are 2) 3. Test statistic 4. The 3-decimal p-Value 5. Test statistic is where compared to CV? (Give a letter: L - Left M - Middle R - Right)This question is from the textbook and I had raised a request as the graph was not visible in your solution. The Cambridge Study in Delinquent Development was under-taken in north London to investigate the links between criminal behavior in young men and the socioeconomic factors of their upbringing. A cohort of 395 boys was followed for about 20 years, starting at the age of 8 or 9. The following table shows the total number of criminal convictions by the boys between the start and end of the study. Number of convictions Frequency 0 265 1 49 2 21 3 19 4 10 5 10 6 2 7 2 8 4 9 2 10 1 11 4 12 3 13 1 14 2 a) Display the frequency distribution in a graph. Which type of graph is most appropriate? (b) Describe the shape of the frequency distribution. Is it skewed or is it symmetric? If skewed, is it positively skewed or negatively skewed? Is it unimodal or bimodal? Are there outliers in the…Which of the following are reasons that are potential limitations to a research study? Choose all that apply. People who were refused to answer The graphs are drawn in a way to mislead the reader The research was not able to survey every individual from the population The funders of the project are partial to the results Trying to conclude that there is a cause – and- effect relationship when something else causes both Two factors cannot be separated to determine which is the one that is responsible to outcome
- Commercial dredging operations in ancient rivers occasionally uncover archaeological artifacts of great importance. One such artifact is Bronze Age spearheads recovered from ancient rivers in Ireland. A recent study gave the following information regarding discoveries of ancient bronze spearheads in Irish rivers (a). Select a Pareto chart. (b). Select a circle graph.Which of these statements is not a condition for an exposure to quality as a risk factor? There is a dose-response relationship There is temporality of the exposure and the disease in terms of occurrence The observed relationship between exposure and the disease in not due to some source of error in the design The observed relationship between exposure and the disease is due to due to some source of error in the design.For the following line graph, State at least one type of conclusion that could be made from the data provided for the KPI. Suggest one other data source that would provide more information to make data-driven decisions. Explain what information that source would supply. Examples: 1)The enrollment data is visualized using a line graph, which shows the total number of students enrolled at STC over time. The data shows that enrollment has been steadily increasing over the past few years. The data source for this information is the Integrated Postsecondary Education Data System (IPEDS). 2) Data on enrollment for the previous five years can be found on the South Texas College KPI webpage. According to the data, enrollment has grown every year during that time. Data on the number of applications received, the number of students accepted, and the number of students enrolling would also be useful in making enrollment decisions. This information would shed light on whether the rise in…
