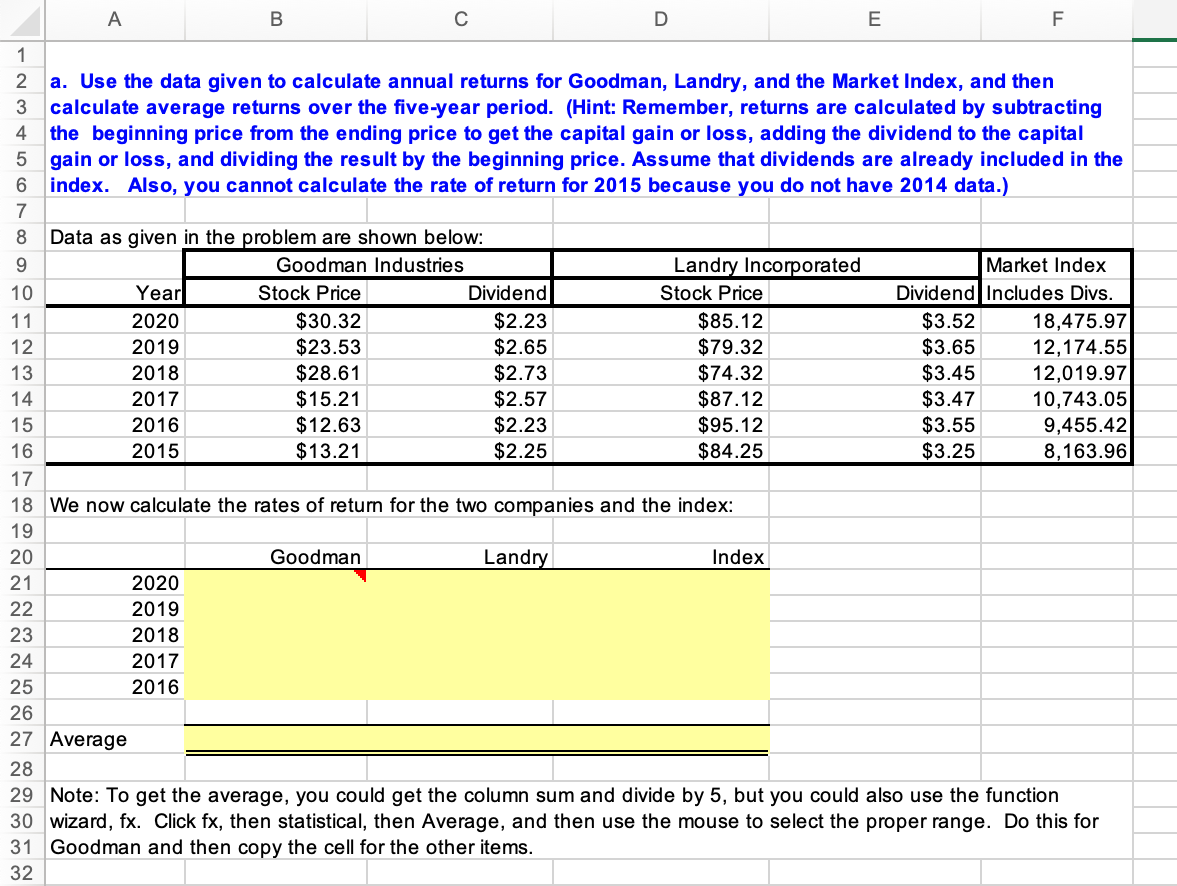
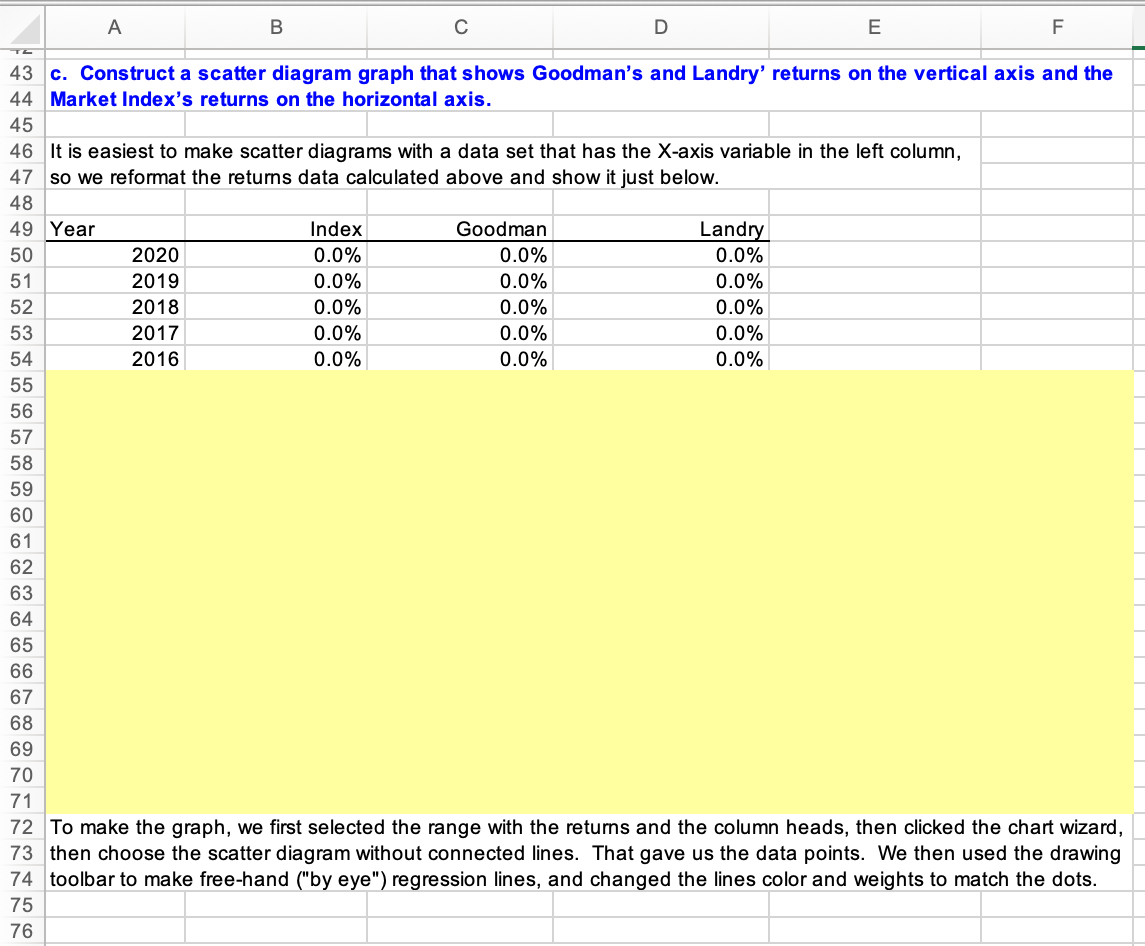
The attached file contains hypothetical data for working this problem. Goodman Corporation’s and Landry Incorporated’s stock prices and dividends, along with the Market Index, are shown in the file. Stock prices are reported for December 31 of each year, and dividends reflect those paid during the year. The market data are adjusted to include dividends. Construct a scatter diagram graph that shows Goodman’s and Landry’ returns on the vertical axis and the Market Index’s returns on the horizontal axis.


Inverse Normal Distribution
The method used for finding the corresponding z-critical value in a normal distribution using the known probability is said to be an inverse normal distribution. The inverse normal distribution is a continuous probability distribution with a family of two parameters.
Mean, Median, Mode
It is a descriptive summary of a data set. It can be defined by using some of the measures. The central tendencies do not provide information regarding individual data from the dataset. However, they give a summary of the data set. The central tendency or measure of central tendency is a central or typical value for a probability distribution.
Z-Scores
A z-score is a unit of measurement used in statistics to describe the position of a raw score in terms of its distance from the mean, measured with reference to standard deviation from the mean. Z-scores are useful in statistics because they allow comparison between two scores that belong to different normal distributions.
- Construct a
scatter diagram graph that shows Goodman’s and Landry’ returns on the vertical axis and the Market Index’s returns on the horizontal axis.


Trending now
This is a popular solution!

Step by step
Solved in 2 steps with 4 images


