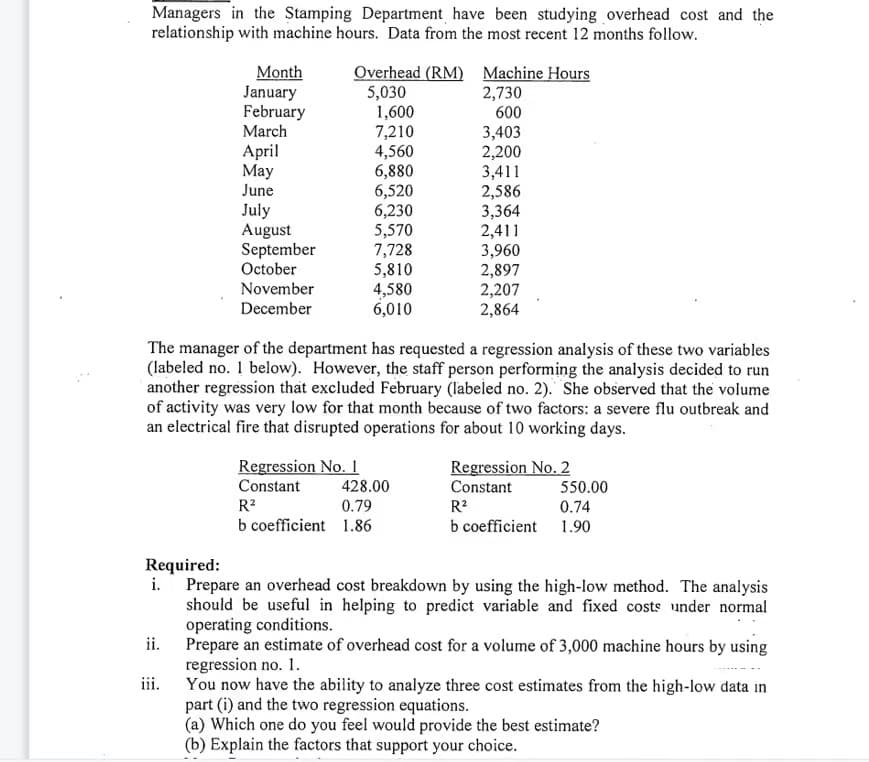
Managers in the Stamping Department have been studying overhead cost and the relationship with machine hours. Data from the most recent 12 months follow. Overhead (RM) Machine Hours 5,030 1,600 7,210 4,560 6,880 6,520 6,230 5,570 7,728 5,810 4,580 6,010 Month January February March 2,730 600 3,403 2,200 3,411 2,586 3,364 2,411 3,960 2,897 2,207 2,864 April May June July August September October November December The manager of the department has requested a regression analysis of these two variables (labeled no. 1 below). However, the staff person performing the analysis decided to run another regression that excluded February (labeled no. 2). She observed that the volume of activity was very low for that month because of two factors: a severe flu outbreak and an electrical fire that disrupted operations for about 10 working days. Regression No. 1 Regression No. 2 Constant 428.00 Constant 550.00 R? 0.79 R? 0.74 b coefficient 1.86 b coefficient 1.90 Required: i. Prepare an overhead cost breakdown by using the high-low method. The analysis should be useful in helping to predict variable and fixed costs under normal operating conditions. ii. Prepare an estimate of overhead cost for a volume of 3,000 machine hours by using regression no. 1. You now have the ability to analyze three cost estimates from the high-low data in part (i) and the two regression equations. (a) Which one do you feel would provide the best estimate? (b) Explain the factors that support your choice. iii.
Managers in the Stamping Department have been studying overhead cost and the relationship with machine hours. Data from the most recent 12 months follow. Overhead (RM) Machine Hours 5,030 1,600 7,210 4,560 6,880 6,520 6,230 5,570 7,728 5,810 4,580 6,010 Month January February March 2,730 600 3,403 2,200 3,411 2,586 3,364 2,411 3,960 2,897 2,207 2,864 April May June July August September October November December The manager of the department has requested a regression analysis of these two variables (labeled no. 1 below). However, the staff person performing the analysis decided to run another regression that excluded February (labeled no. 2). She observed that the volume of activity was very low for that month because of two factors: a severe flu outbreak and an electrical fire that disrupted operations for about 10 working days. Regression No. 1 Regression No. 2 Constant 428.00 Constant 550.00 R? 0.79 R? 0.74 b coefficient 1.86 b coefficient 1.90 Required: i. Prepare an overhead cost breakdown by using the high-low method. The analysis should be useful in helping to predict variable and fixed costs under normal operating conditions. ii. Prepare an estimate of overhead cost for a volume of 3,000 machine hours by using regression no. 1. You now have the ability to analyze three cost estimates from the high-low data in part (i) and the two regression equations. (a) Which one do you feel would provide the best estimate? (b) Explain the factors that support your choice. iii.

Glencoe Algebra 1, Student Edition, 9780079039897, 0079039898, 2018
18th Edition
ISBN:9780079039897
Author:Carter
Publisher:Carter
Chapter10: Statistics
Section10.6: Summarizing Categorical Data
Problem 23PPS

Related questions
Question
Transcribed Image Text:Managers in the Stamping Department have been studying overhead cost and the
relationship with machine hours. Data from the most recent 12 months follow.
Overhead (RM) Machine Hours
5,030
1,600
7,210
4,560
6,880
6,520
6,230
5,570
7,728
5,810
4,580
6,010
Month
January
February
March
2,730
600
3,403
2,200
3,411
2,586
3,364
2,411
3,960
2,897
2,207
2,864
April
Мay
June
July
August
September
October
November
December
The manager of the department has requested a regression analysis of these two variables
(labeled no. 1 below). However, the staff person performing the analysis decided to run
another regression that excluded February (labeled no. 2). She observed that the volume
of activity was very low for that month because of two factors: a severe flu outbreak and
an electrical fire that disrupted operations for about 10 working days.
Regression No. 1
Constant
Regression No. 2
428.00
Constant
550.00
R?
0.79
0.74
b coefficient 1.90
R?
b coefficient 1.86
Required:
i. Prepare an overhead cost breakdown by using the high-low method. The analysis
should be useful in helping to predict variable and fixed costs under normal
operating conditions.
ii.
Prepare an estimate of overhead cost for a volume of 3,000 machine hours by using
regression no. 1.
iii.
You now have the ability to analyze three cost estimates from the high-low data in
part (i) and the two regression equations.
(a) Which one do you feel would provide the best estimate?
(b) Explain the factors that support your choice.
Expert Solution
This question has been solved!
Explore an expertly crafted, step-by-step solution for a thorough understanding of key concepts.

This is a popular solution!

Trending now
This is a popular solution!

Step by step
Solved in 5 steps with 5 images

Recommended textbooks for you
Glencoe Algebra 1, Student Edition, 9780079039897…
Algebra
ISBN:
9780079039897
Author:
Carter
Publisher:
McGraw Hill

College Algebra (MindTap Course List)
Algebra
ISBN:
9781305652231
Author:
R. David Gustafson, Jeff Hughes
Publisher:
Cengage Learning

Big Ideas Math A Bridge To Success Algebra 1: Stu…
Algebra
ISBN:
9781680331141
Author:
HOUGHTON MIFFLIN HARCOURT
Publisher:
Houghton Mifflin Harcourt
Glencoe Algebra 1, Student Edition, 9780079039897…
Algebra
ISBN:
9780079039897
Author:
Carter
Publisher:
McGraw Hill
College Algebra (MindTap Course List)
Algebra
ISBN:
9781305652231
Author:
R. David Gustafson, Jeff Hughes
Publisher:
Cengage Learning
Big Ideas Math A Bridge To Success Algebra 1: Stu…
Algebra
ISBN:
9781680331141
Author:
HOUGHTON MIFFLIN HARCOURT
Publisher:
Houghton Mifflin Harcourt