Managers of 1200 different retail outlets make twice-a-month restocking orders froma central warehouse. Past experience shows that 4% of the orders result in one or moreerrors such as wrong item shipped, wrong quantity shipped, and item requested butnot shipped. random samples of 200 orders are selected monthly and checked foraccuracy.a. Construct a control chart for this situation.b. Six months of data show the following numbers of orders with one or more errors: 10,15, 6, 13, 8, and 17. Plot the data on the control chart. what does your plot indicateabout the order process?


Inverse Normal Distribution
The method used for finding the corresponding z-critical value in a normal distribution using the known probability is said to be an inverse normal distribution. The inverse normal distribution is a continuous probability distribution with a family of two parameters.
Mean, Median, Mode
It is a descriptive summary of a data set. It can be defined by using some of the measures. The central tendencies do not provide information regarding individual data from the dataset. However, they give a summary of the data set. The central tendency or measure of central tendency is a central or typical value for a probability distribution.
Z-Scores
A z-score is a unit of measurement used in statistics to describe the position of a raw score in terms of its distance from the mean, measured with reference to standard deviation from the mean. Z-scores are useful in statistics because they allow comparison between two scores that belong to different normal distributions.
Managers of 1200 different retail outlets make twice-a-month restocking orders from
a central warehouse. Past experience shows that 4% of the orders result in one or more
errors such as wrong item shipped, wrong quantity shipped, and item requested but
not shipped. random samples of 200 orders are selected monthly and checked for
accuracy.
a. Construct a control chart for this situation.
b. Six months of data show the following numbers of orders with one or more errors: 10,
15, 6, 13, 8, and 17. Plot the data on the control chart. what does your plot indicate
about the order process?
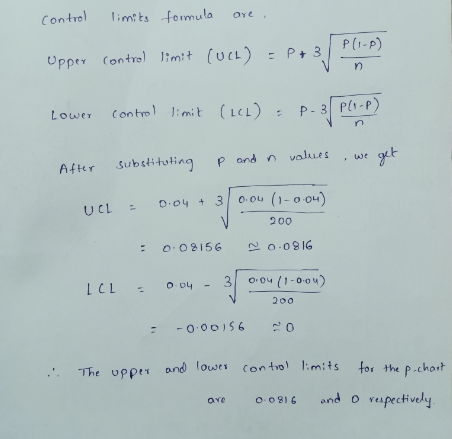
Given, 4% of the orders result in one or more errors.
Let, the proportion of errors p=0.04
Given, random sample of orders n = 200

Step by step
Solved in 4 steps with 2 images


