Manual. 7.1 Seven students made the following scores on two quizzes, X and Y: 7. A B C DE FG 3 9 7 8 4 6 7 7 8 6 Student: Score on X: Score on Y: 6 5 7 (a) Construct a scatter diagram of the relationship between these two variables. What is the direction of the relationship? (b) Compute r to two decimals using the raw-score method. (c) If the two quizzes covered the same subject matter, what is it about the students' performance that r measures?
Manual. 7.1 Seven students made the following scores on two quizzes, X and Y: 7. A B C DE FG 3 9 7 8 4 6 7 7 8 6 Student: Score on X: Score on Y: 6 5 7 (a) Construct a scatter diagram of the relationship between these two variables. What is the direction of the relationship? (b) Compute r to two decimals using the raw-score method. (c) If the two quizzes covered the same subject matter, what is it about the students' performance that r measures?

Elementary Geometry For College Students, 7e
7th Edition
ISBN:9781337614085
Author:Alexander, Daniel C.; Koeberlein, Geralyn M.
Publisher:Alexander, Daniel C.; Koeberlein, Geralyn M.
Chapter1: Line And Angle Relationships
Section1.4: Relationships: Perpendicular Lines
Problem 17E: Does the relation is a brother of have a reflexive property consider one male? A symmetric property...

Related questions
Question
Can someone explain how to find r please. I got 45.37 and I have attched a picture of my work as well and the questions and data . The problem I am working on is problem 7.1.
Transcribed Image Text:KEY SYMBOLS
TEY TERMS, CON CEPTS, AND SYMBOLS
linear relationship
no correlation (p. 97)
coefficient of
correlation (p. 92)
prediction (p. 92)
Sir Francis Galton
(p. 93)
bivariate distribution
93)
cross-proc
(p. 10
Spearmar
curvilinear relationship
correlation (p. 98)
(p. 98)
values of r
corre!
positive correlation
coeff
(p.
Karl Pearson (p. 94)
scatter diagram (p. 95)
negative correlation
(p. 97)
product-moment
correlation
coefficient (p. 100)
linear te
(p.
PROBLEMS
Note: Answers to odd-numbered questions are in Appendix C.
Answers to even-numbered questions are in the Instructor's
(a) Construct
of the relation
Manual.
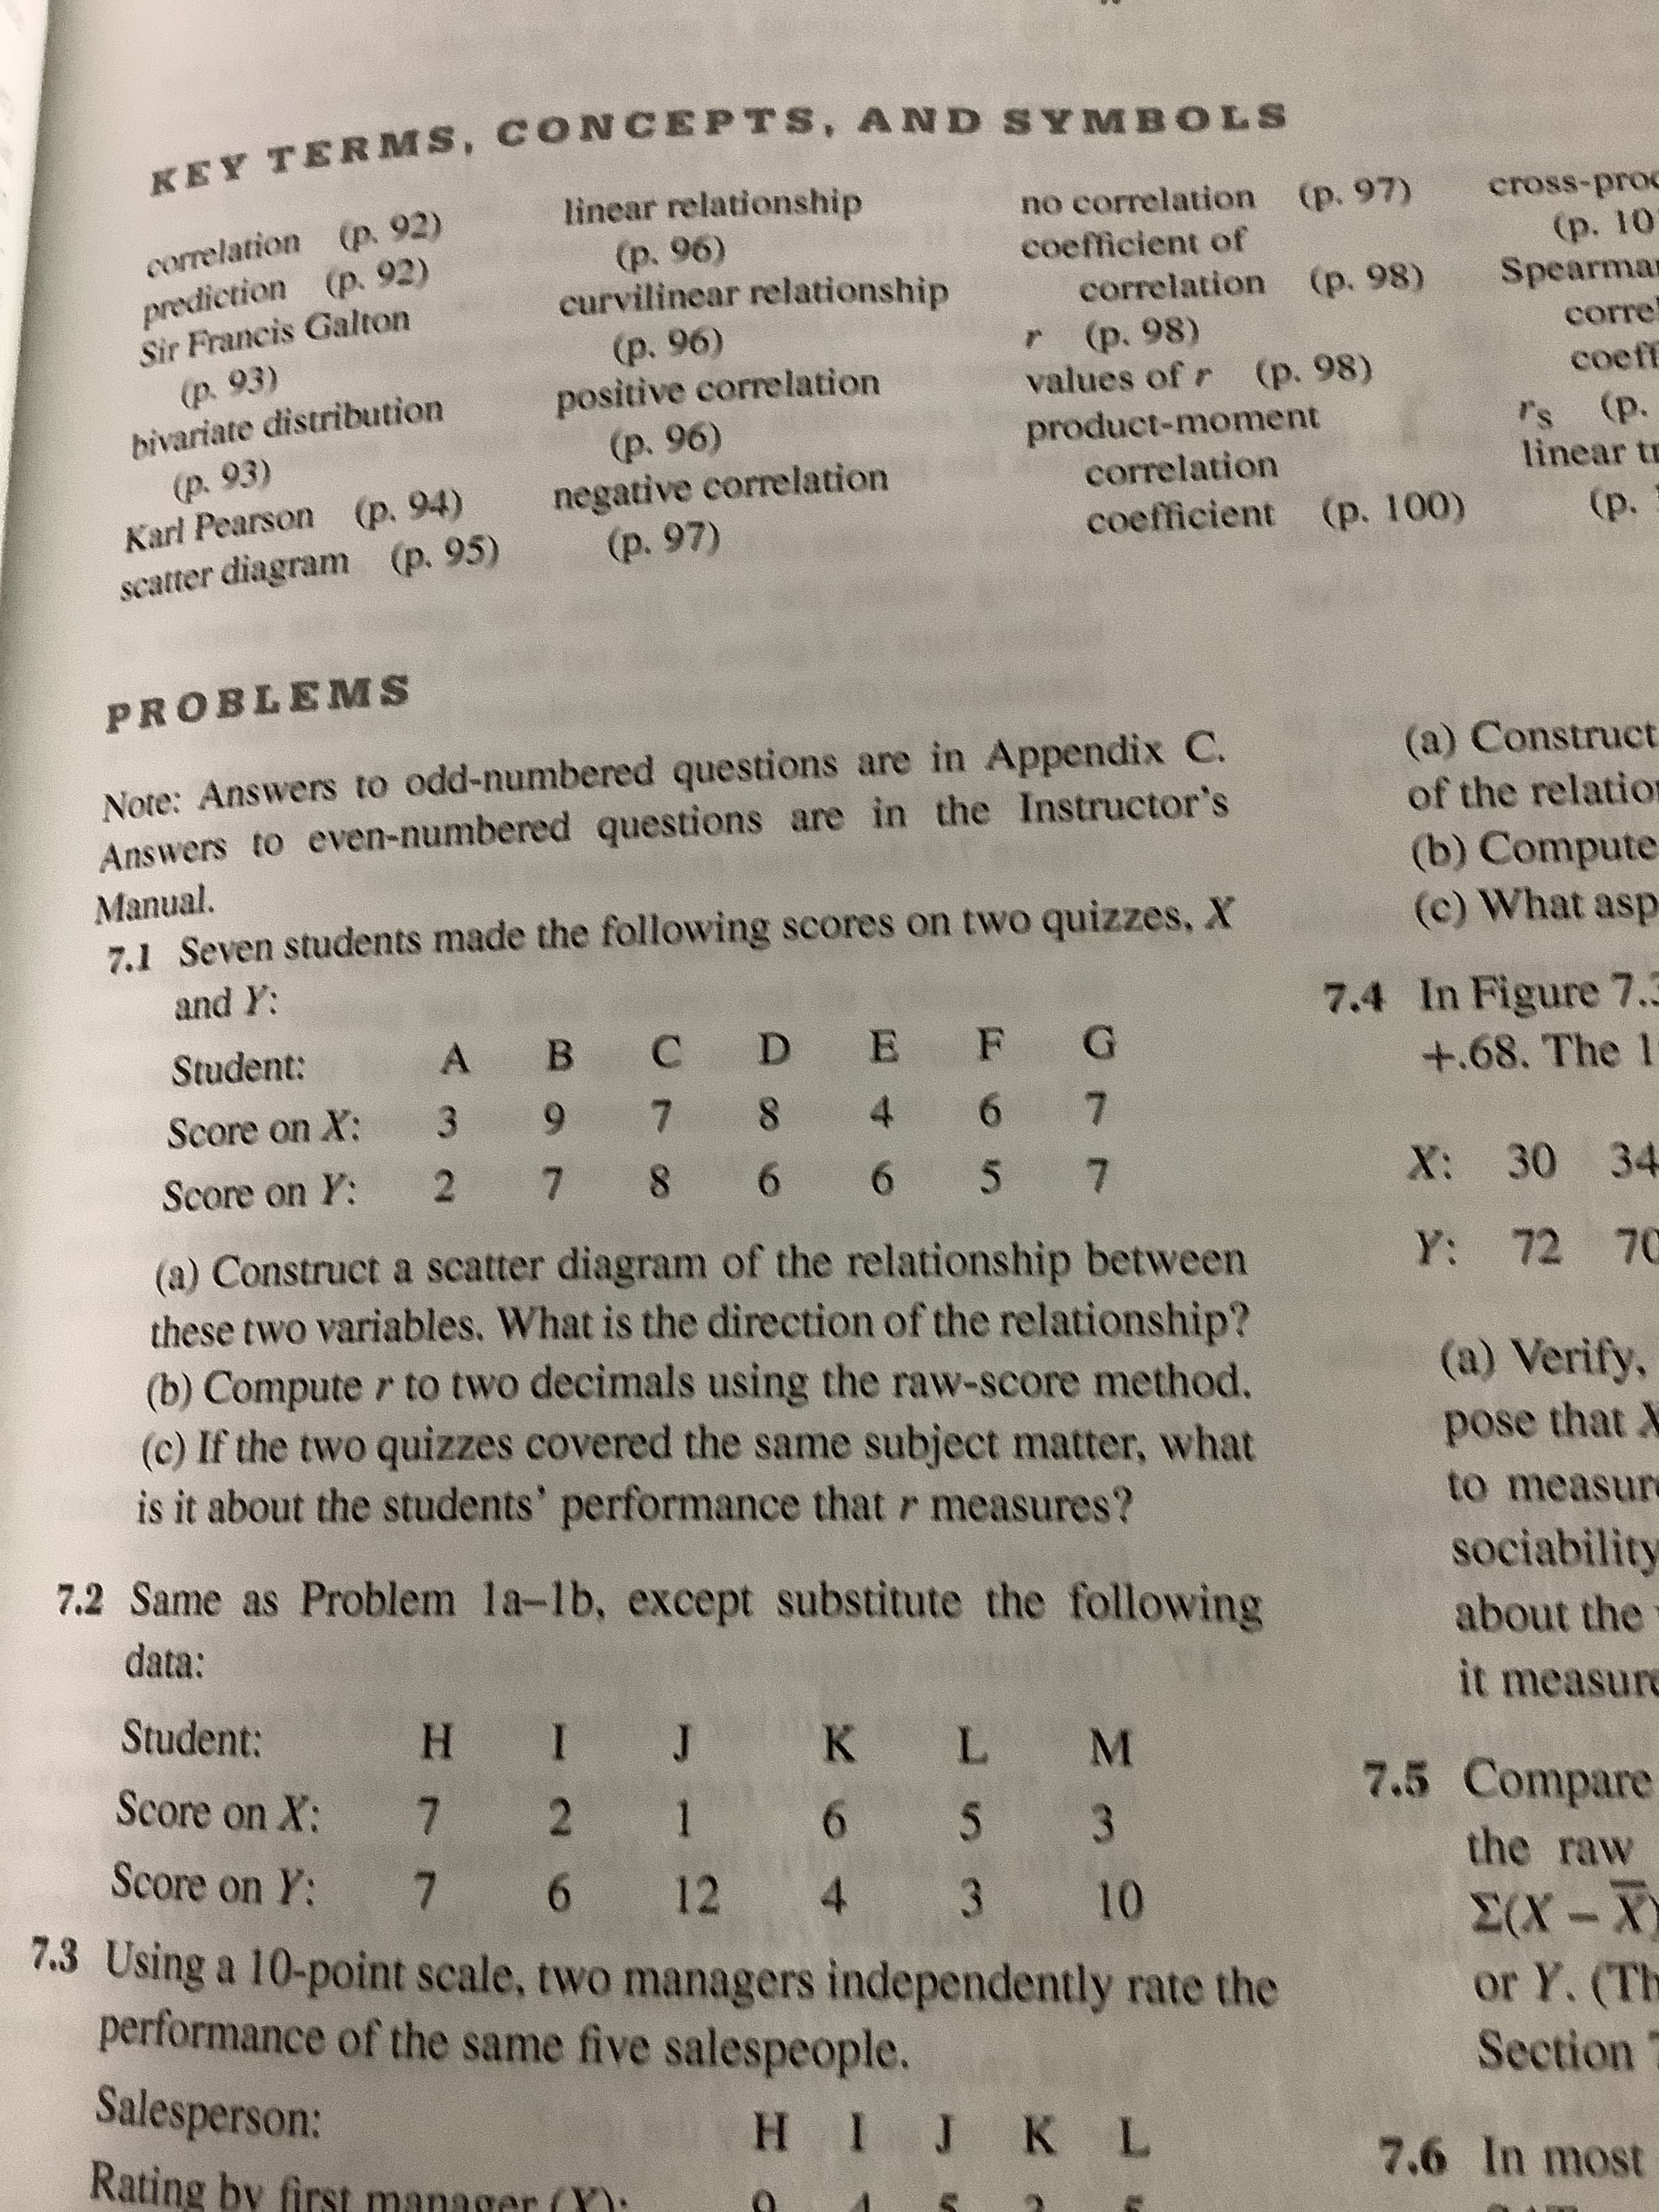
7.1 Seven students made the following scores on two quizzes, X
(b) Compute
(c) What asp
and Y:
7.4 In Figure 7.3
+.68. The 1
Student:
A B C D E F G
3.
2 7 8 6 6 5 7
Score on X:
8.
4.
9.
Score on Y:
X: 30 34
(a) Construct a scatter diagram of the relationship between
these two variables. What is the direction of the relationship?
(b) Compute r to two decimals using the raw-score method,
(c) If the two quizzes covered the same subject matter, what
is it about the students' performance that r measures?
Y: 72 7C
(a) Verify,
pose that X
to measure
7.2 Same as Problem la-lb, except substitute the following
sociability
data:
about the
Student:
it measure
H.
I J K L M
Score on X:
7.
2 1 6 5 3
7.5 Compare
Score on Y:
6 12 4 3 10
the raw
7.
7.3 Using a 10-point scale, two managers independently rate the
performance of the same five salespeople.
or Y. (Th
Section 7
Salesperson:
Rating by first manager (Y):
7.6 In most
Transcribed Image Text:2.
Scomd
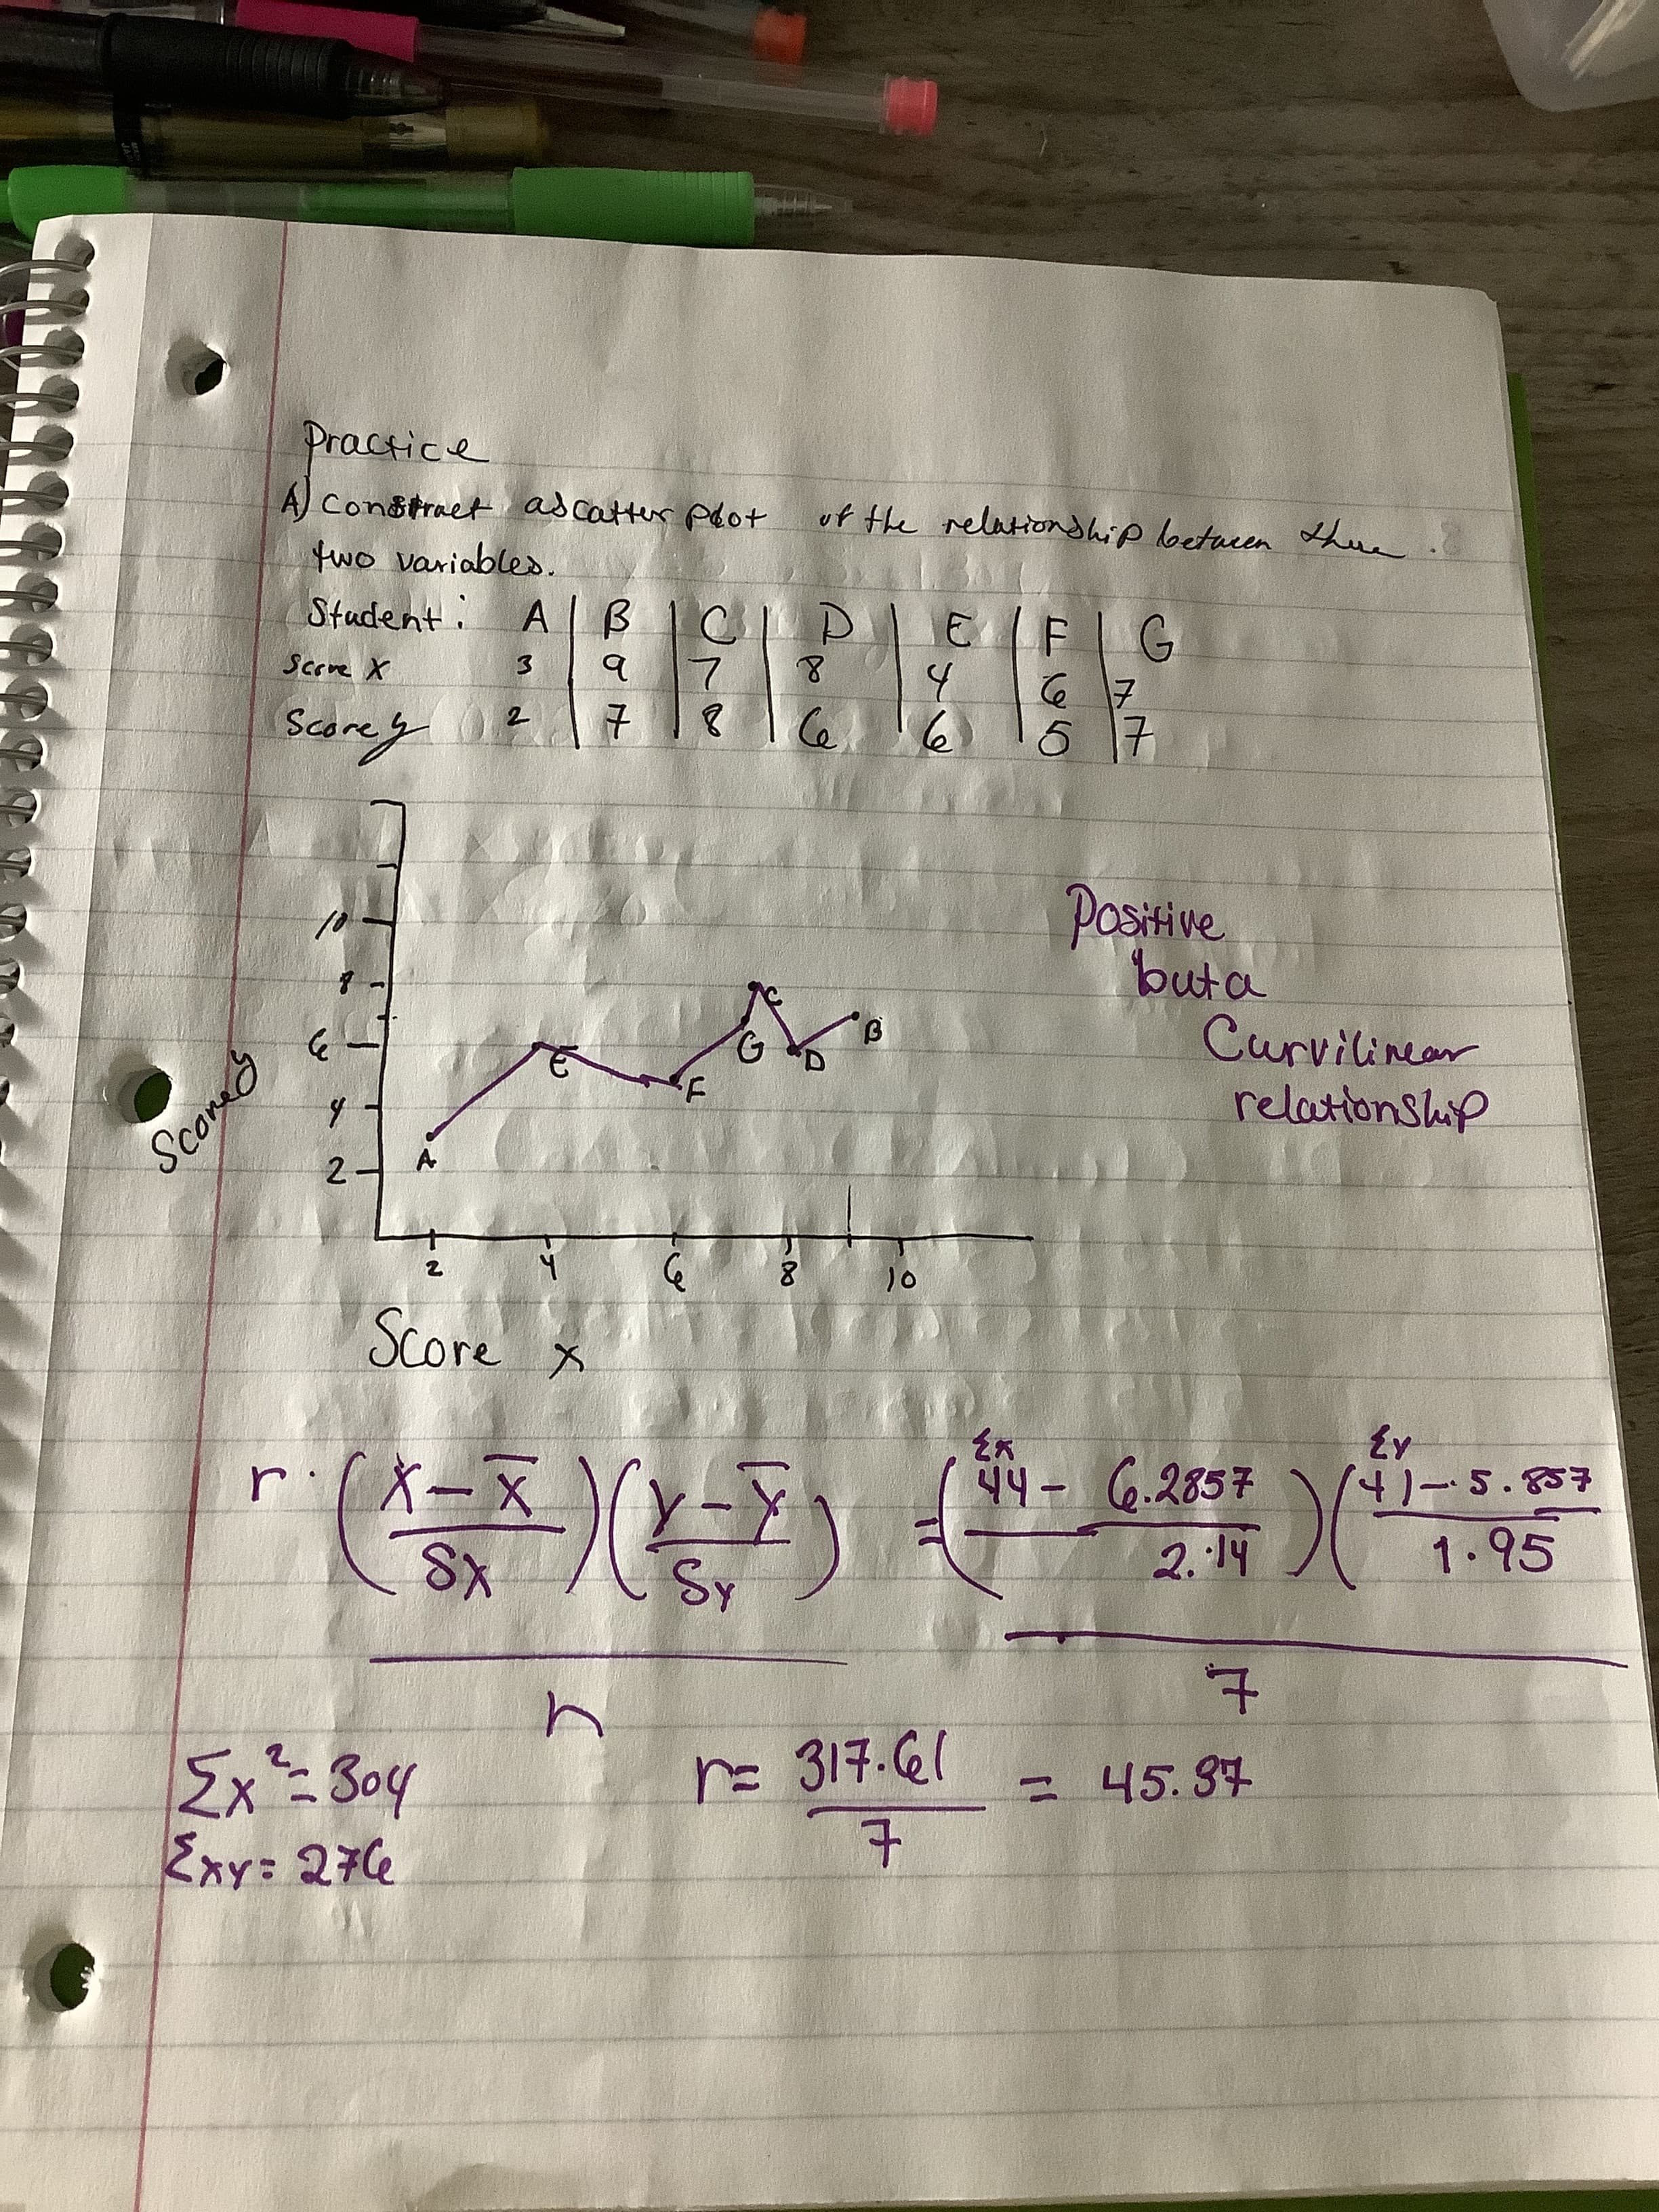
Practice
A) Condtract as catter Plot
uf the relationdhip loetacen
thue
two variables.
Student i A B IC
EFG
Positive
buta
Curvilinear
relationShp
Score x
h3Si(ナ
7.45
13
44-6.2857
1.95
7.
=45.37
317.61
Ex-304
Exy: 276
7.
Expert Solution
This question has been solved!
Explore an expertly crafted, step-by-step solution for a thorough understanding of key concepts.

This is a popular solution!

Trending now
This is a popular solution!

Step by step
Solved in 5 steps with 3 images

Recommended textbooks for you
Elementary Geometry For College Students, 7e
Geometry
ISBN:
9781337614085
Author:
Alexander, Daniel C.; Koeberlein, Geralyn M.
Publisher:
Cengage,

Algebra & Trigonometry with Analytic Geometry
Algebra
ISBN:
9781133382119
Author:
Swokowski
Publisher:
Cengage
Elementary Geometry For College Students, 7e
Geometry
ISBN:
9781337614085
Author:
Alexander, Daniel C.; Koeberlein, Geralyn M.
Publisher:
Cengage,
Algebra & Trigonometry with Analytic Geometry
Algebra
ISBN:
9781133382119
Author:
Swokowski
Publisher:
Cengage