A point estimate is defined as: O A single value that is the best estimate of an unknown population parameter O A single value that is the best estimate of an unknown sample statistic O The true value of the population mean O Estimate of the sample size
A point estimate is defined as: O A single value that is the best estimate of an unknown population parameter O A single value that is the best estimate of an unknown sample statistic O The true value of the population mean O Estimate of the sample size

MATLAB: An Introduction with Applications
6th Edition
ISBN:9781119256830
Author:Amos Gilat
Publisher:Amos Gilat
Chapter1: Starting With Matlab
Section: Chapter Questions
Problem 1P

Related questions
Question
Please answer asap
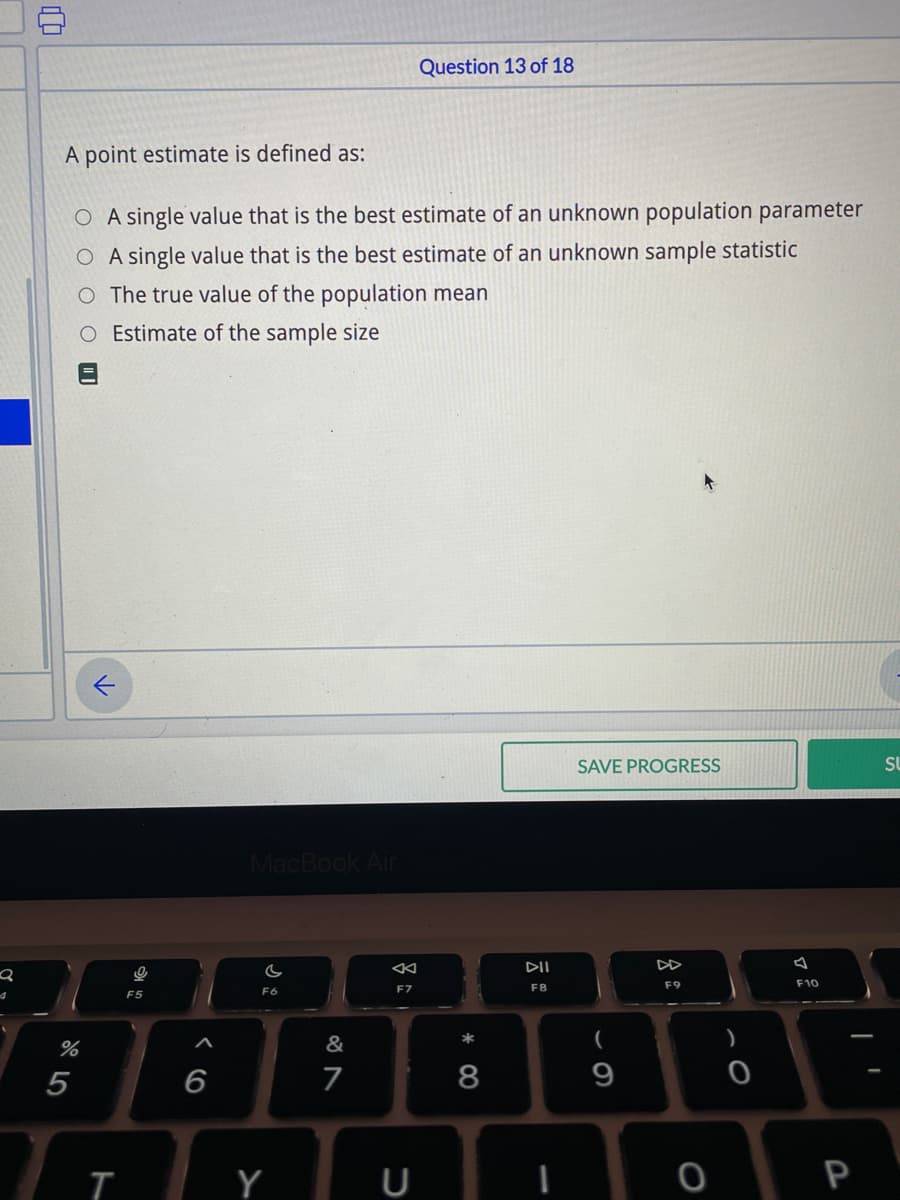
Transcribed Image Text:Question 13 of 18
A point estimate is defined as:
O A single value that is the best estimate of an unknown population parameter
O A single value that is the best estimate of an unknown sample statistic
O The true value of the population mean
O Estimate of the sample size
SAVE PROGRESS
SU
MacBook Air
DII
F9
F10
F6
F7
F8
F5
&
(
5
7
8
9
Y
P
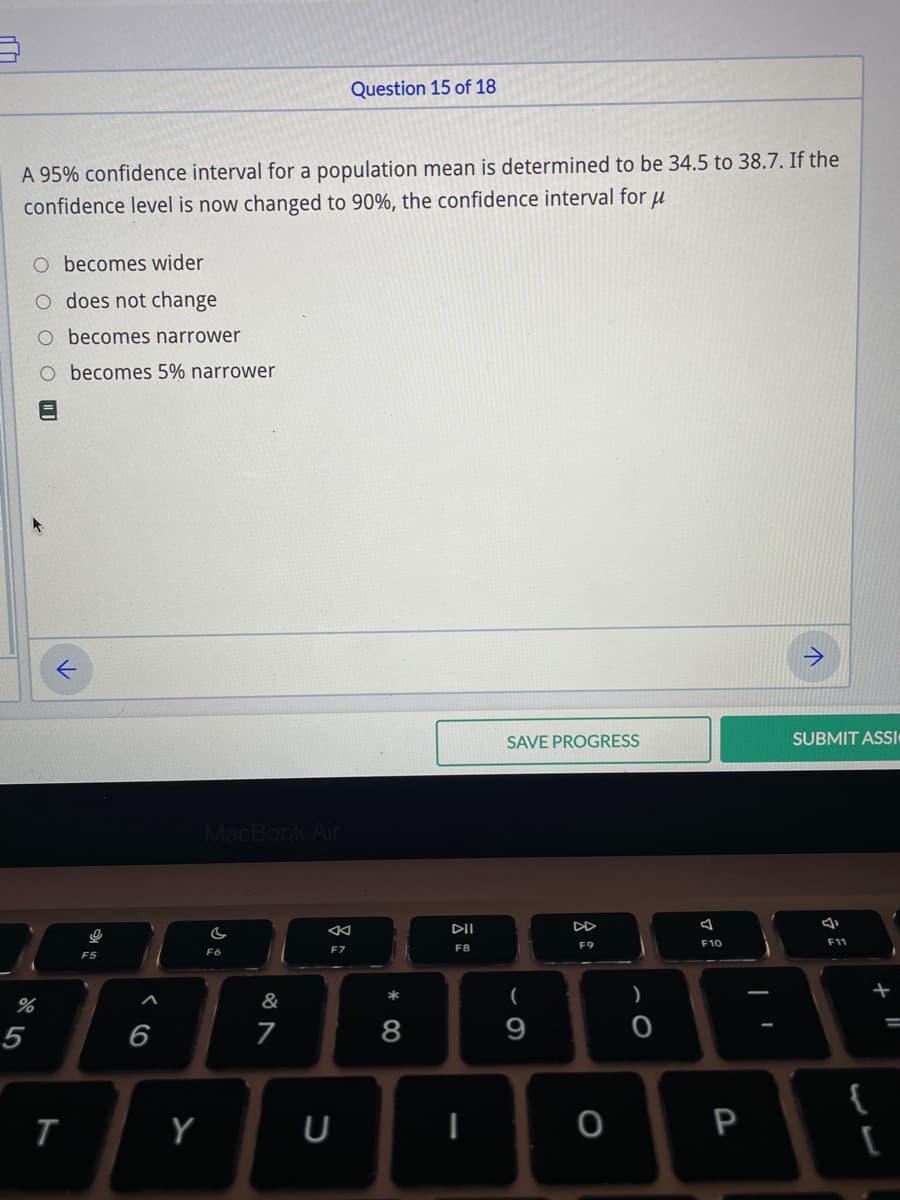
Transcribed Image Text:Question 15 of 18
A 95% confidence interval for a population mean is determined to be 34.5 to 38.7. If the
confidence level is now changed to 90%, the confidence interval for u
becomes wider
O does not change
O becomes narrower
becomes 5% narrower
->
SAVE PROGRESS
SUBMIT ASSI
MacBook Air
DII
DD
F10
F11
F9
F6
F7
F5
*
&
5
6
8
9
{
U
Expert Solution
This question has been solved!
Explore an expertly crafted, step-by-step solution for a thorough understanding of key concepts.

Step by step
Solved in 2 steps

Recommended textbooks for you
MATLAB: An Introduction with Applications
Statistics
ISBN:
9781119256830
Author:
Amos Gilat
Publisher:
John Wiley & Sons Inc

Probability and Statistics for Engineering and th…
Statistics
ISBN:
9781305251809
Author:
Jay L. Devore
Publisher:
Cengage Learning

Statistics for The Behavioral Sciences (MindTap C…
Statistics
ISBN:
9781305504912
Author:
Frederick J Gravetter, Larry B. Wallnau
Publisher:
Cengage Learning
MATLAB: An Introduction with Applications
Statistics
ISBN:
9781119256830
Author:
Amos Gilat
Publisher:
John Wiley & Sons Inc
Probability and Statistics for Engineering and th…
Statistics
ISBN:
9781305251809
Author:
Jay L. Devore
Publisher:
Cengage Learning
Statistics for The Behavioral Sciences (MindTap C…
Statistics
ISBN:
9781305504912
Author:
Frederick J Gravetter, Larry B. Wallnau
Publisher:
Cengage Learning

Elementary Statistics: Picturing the World (7th E…
Statistics
ISBN:
9780134683416
Author:
Ron Larson, Betsy Farber
Publisher:
PEARSON

The Basic Practice of Statistics
Statistics
ISBN:
9781319042578
Author:
David S. Moore, William I. Notz, Michael A. Fligner
Publisher:
W. H. Freeman

Introduction to the Practice of Statistics
Statistics
ISBN:
9781319013387
Author:
David S. Moore, George P. McCabe, Bruce A. Craig
Publisher:
W. H. Freeman