Manufacturer of a CNC machine claims that the average warm-up time for their machine is 10 minutes. We would like to test this olaim at a 0.10 significance level and therefore run 10 trials that resuit in the following warm-up durations (in minutes). Warm-up durations are assumed to follow a Normal distribut 10.0. 0.8, 10.0, 10.4, 10.4, 10.5. 0.0, 0.8, 10.0. 10.3 O Slink here to viewR2Oe 1of the table of critical values of the t-distribution. Cliek here to viewRRas 2 the tanle od criticalvalue of the tedlistribution. (a) Choose the correct H, and H, below. O A. Ho: = 10 against H, u< 10 OB. H, 10 against H, 10 OC. H u> 10 against H, 10 OD. H: = 10 against H, u> 10 OE. H: u< 10 against H,: 10 OF Hi u 10 against H,: u 10 (b) The calculated t value is (Round to two decimal places including any zeros.) (0) Choose the correct critical region below. (Round to two decimal places including any zeros.) OA t OB. »O Oc t« or t»O (d) Choose the correct conclusion below. O A. Reject the null hypothesis because the average warm-up time is significantly different from 10 minutes. OB. Reject the null hypothesis because the average warm-up time is not significantly different from 10 minutes. OC. Do not reject the null hypothesis because the average warm-up time is not significantly different from 10 minutes. OD. Do not reject the null hypothesis because the average warm-up time is significantly different from 10 minutes
Manufacturer of a CNC machine claims that the average warm-up time for their machine is 10 minutes. We would like to test this olaim at a 0.10 significance level and therefore run 10 trials that resuit in the following warm-up durations (in minutes). Warm-up durations are assumed to follow a Normal distribut 10.0. 0.8, 10.0, 10.4, 10.4, 10.5. 0.0, 0.8, 10.0. 10.3 O Slink here to viewR2Oe 1of the table of critical values of the t-distribution. Cliek here to viewRRas 2 the tanle od criticalvalue of the tedlistribution. (a) Choose the correct H, and H, below. O A. Ho: = 10 against H, u< 10 OB. H, 10 against H, 10 OC. H u> 10 against H, 10 OD. H: = 10 against H, u> 10 OE. H: u< 10 against H,: 10 OF Hi u 10 against H,: u 10 (b) The calculated t value is (Round to two decimal places including any zeros.) (0) Choose the correct critical region below. (Round to two decimal places including any zeros.) OA t OB. »O Oc t« or t»O (d) Choose the correct conclusion below. O A. Reject the null hypothesis because the average warm-up time is significantly different from 10 minutes. OB. Reject the null hypothesis because the average warm-up time is not significantly different from 10 minutes. OC. Do not reject the null hypothesis because the average warm-up time is not significantly different from 10 minutes. OD. Do not reject the null hypothesis because the average warm-up time is significantly different from 10 minutes

Glencoe Algebra 1, Student Edition, 9780079039897, 0079039898, 2018
18th Edition
ISBN:9780079039897
Author:Carter
Publisher:Carter
Chapter10: Statistics
Section10.4: Distributions Of Data
Problem 19PFA

Related questions

Question
100%
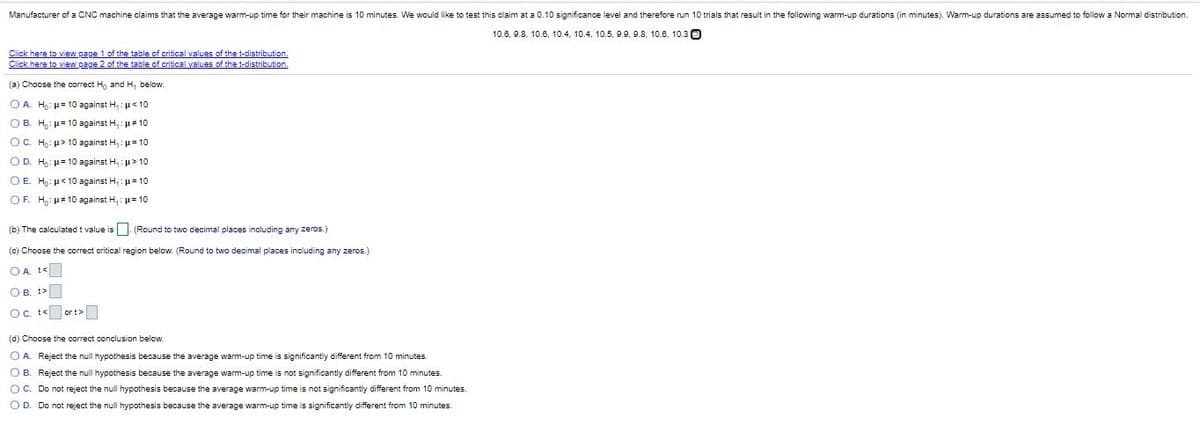
Transcribed Image Text:Manufacturer of a CNC machine claims that the average warm-up time for their machine is 10 minutes. We would like to test this claim at a 0.10 significance level and therefore run 10 trials that result in the following warm-up durations (in minutes). Warm-up durations are assumed to follow a Normal distribution.
10.6, 9.8, 10.6, 10.4, 10.4, 10.5, 9.9, 9.8, 10.6, 10.30
Click here to view page 1 of the table of critical values of the t-distribution.
Click here to view page 2 of the table of critical values of the t-distribution.
(a) Choose the correct H, and H, below.
O A. H: u= 10 against H,: u< 10
O B. H,: u= 10 against H, : u# 10
OC. H,: µ> 10 against H,: u= 10o
O D. H,: u= 10 against H, : > 10
O E. H,: µ< 10 against H, : u= 10o
OF. H,: H10 against H,: p= 10
(b) The calculated t value is (Round to two decimal places including any zeros.)
(c) Choose the correct critical region below. (Round to two decimal places including any zeros.)
OA. t<
OB. t>
Oc. t< or >
(d) Choose the correct conclusion below.
O A. Reject the nul hypothesis because the average wam-up time is significantly different from 10 minutes.
O B. Reject the null hypothesis because the average wam-up time is not significantly different from 10 minutes.
O C. Do not reject the null hypothesis because the average warm-up time is not significantly different from 10 minutes.
O D. Do not reject the null hypothesis because the average warm-up time is significantly different from 10 minutes.
Expert Solution
This question has been solved!
Explore an expertly crafted, step-by-step solution for a thorough understanding of key concepts.

Step by step
Solved in 2 steps

Knowledge Booster


Learn more about
Need a deep-dive on the concept behind this application? Look no further. Learn more about this topic, statistics and related others by exploring similar questions and additional content below.Recommended textbooks for you
Glencoe Algebra 1, Student Edition, 9780079039897…
Algebra
ISBN:
9780079039897
Author:
Carter
Publisher:
McGraw Hill
Glencoe Algebra 1, Student Edition, 9780079039897…
Algebra
ISBN:
9780079039897
Author:
Carter
Publisher:
McGraw Hill