Many investors and financial analysts believe the Dow Jones Industrial Average (DJIA) gives a good barometer of the overall stock market. On January 31, 2006, 9 of the 30 stocks making up the DJIA increased in price (The Wall Street Journal, February 1, 2006). On the basis of this fact, a financial analyst claims we can assume that 30% of the stocks traded on the New York Stock Exchange (NYSE) went up the same day. A sample of 79 stocks traded on the NYSE that day showed that 26 went up. You are conducting a study to see if the proportion of stocks that went up is is significantly more than 0.3. You use a significance level of a = 0.05. What is the test statistic for this sample? (Report answer accurate to three decimal places.) test statistic = What is the p-value for this sample? (Report answer accurate to four decimal places.) p-value = The p-value is.. O less than (or equal to) a O greater than a
Many investors and financial analysts believe the Dow Jones Industrial Average (DJIA) gives a good barometer of the overall stock market. On January 31, 2006, 9 of the 30 stocks making up the DJIA increased in price (The Wall Street Journal, February 1, 2006). On the basis of this fact, a financial analyst claims we can assume that 30% of the stocks traded on the New York Stock Exchange (NYSE) went up the same day. A sample of 79 stocks traded on the NYSE that day showed that 26 went up. You are conducting a study to see if the proportion of stocks that went up is is significantly more than 0.3. You use a significance level of a = 0.05. What is the test statistic for this sample? (Report answer accurate to three decimal places.) test statistic = What is the p-value for this sample? (Report answer accurate to four decimal places.) p-value = The p-value is.. O less than (or equal to) a O greater than a

Glencoe Algebra 1, Student Edition, 9780079039897, 0079039898, 2018
18th Edition
ISBN:9780079039897
Author:Carter
Publisher:Carter
Chapter10: Statistics
Section10.6: Summarizing Categorical Data
Problem 26PPS

Related questions

Question
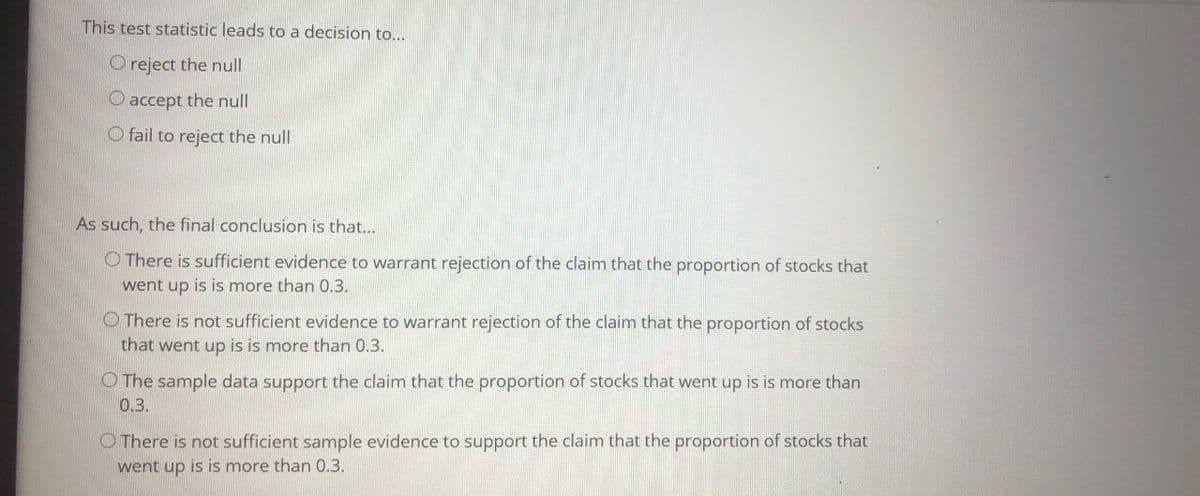
Transcribed Image Text:This test statistic leads to a decision to...
O reject the null
O accept the null
O fail to reject the null
As such, the final conclusion is that...
O There is sufficient evidence to warrant rejection of the claim that the proportion of stocks that
went up is is more than 0.3.
O There is not sufficient evidence to warrant rejection of the claim that the proportion of stocks
that went up is is more than 0.3.
O The sample data support the claim that the proportion of stocks that went up is is more than
03.
O There is not sufficient sample evidence to support the claim that the proportion of stocks that
went up is is more than 0.3.
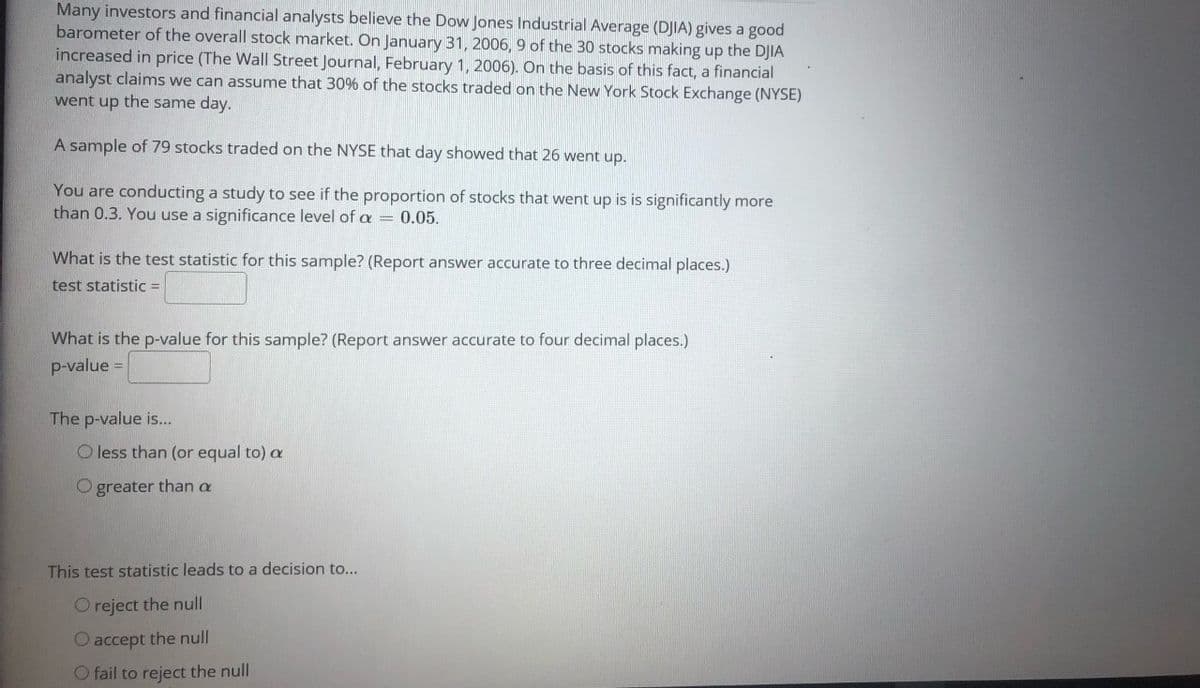
Transcribed Image Text:Many investors and financial analysts believe the Dow Jones Industrial Average (DJIA) gives a good
barometer of the overall stock market. On January 31, 2006, 9 of the 30 stocks making up the DJIA
increased in price (The Wall Street Journal, February 1, 2006). On the basis of this fact, a financial
analyst claims we can assume that 30% of the stocks traded on the New York Stock Exchange (NYSE)
went up the same day.
A sample of 79 stocks traded on the NYSE that day showed that 26 went up.
You are conducting a study to see if the proportion of stocks that went up is is significantly more
than 0.3. You use a significance level of a= 0.05.
What is the test statistic for this sample? (Report answer accurate to three decimal places.)
test statistic =
What is the p-value for this sample? (Report answer accurate to four decimal places.)
p-value =
The p-value is...
O less than (or equal to) a
O greater than a
This test statistic leads to a decision to...
O reject the null
O accept the null
O fail to reject the null
Expert Solution
This question has been solved!
Explore an expertly crafted, step-by-step solution for a thorough understanding of key concepts.

This is a popular solution!

Trending now
This is a popular solution!

Step by step
Solved in 3 steps with 3 images

Knowledge Booster


Learn more about
Need a deep-dive on the concept behind this application? Look no further. Learn more about this topic, statistics and related others by exploring similar questions and additional content below.Recommended textbooks for you
Glencoe Algebra 1, Student Edition, 9780079039897…
Algebra
ISBN:
9780079039897
Author:
Carter
Publisher:
McGraw Hill

Glencoe Algebra 1, Student Edition, 9780079039897…
Algebra
ISBN:
9780079039897
Author:
Carter
Publisher:
McGraw Hill