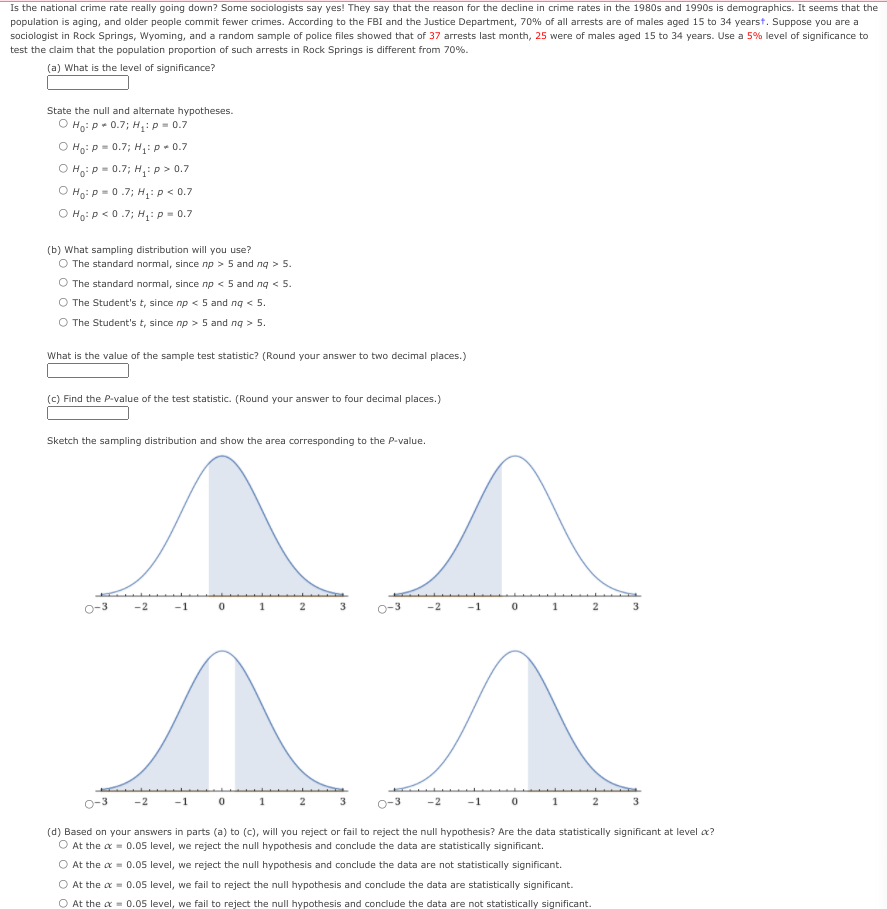
Is the national crime rate really going down? Some sociologists say yes! They say that the reason for the decline in crime rates in the 1980s and 1990s is demographics. It seems that the population is aging, and older people commit fewer crimes. According to the FBI and the Justice Department, 70% of all arrests are of males aged 15 to 34 yearst. Suppose you are a sociologist in Rock Springs, Wyoming, and a random sample of police files showed that of 37 arrests last month, 25 were of males aged 15 to 34 years. Use a 5% level of significance to test the claim that the population proportion of such arrests in Rock Springs is different from 70%. (a) What is the level of significance? State the null and alternate hypotheses. O Ho: p+ 0.7; H:p- 0.7 O Ho: p = 0.7; H,: p - 0.7 O Ho: p = 0.7; H,: p > 0.7 O Hoi p = 0.7; H,: p < 0.7 O Ho: p < 0.7; Hp = 0.7 (b) What sampling distribution will you use? O The standard normal, since np > 5 and ng > 5. The standard normal, since np < 5 and ng < 5. The Student's t, since np < 5 and ng < 5. The Student's t, since np > 5 and ng > 5. What is the value of the sample test statistic? (Round your answer to two decimal places.) (C) Find the P-value of the test statistic. (Round your answer to four decimal places.) Sketch the sampling distribution and show the area corresponding to the P-value. -2 -1 1 2 -2 -1 1 -2 (d) Based on your answers in parts (a) to (c), will you reject or fail to reject the null hypothesis? Are the data statistically significant at level a? O At the a = 0.05 level, we reject the null hypothesis and conclude the data are statistically significant. At the a = 0.05 level, we reject the null hypothesis and conclude the data are not statistically significant. At the a = 0.05 level, we fail to reject the null hypothesis and conclude the data are statistically significant. O At the a = 0.05 level, we fail to reject the null hypothesis and conclude the data are not statistically significant.
Is the national crime rate really going down? Some sociologists say yes! They say that the reason for the decline in crime rates in the 1980s and 1990s is demographics. It seems that the population is aging, and older people commit fewer crimes. According to the FBI and the Justice Department, 70% of all arrests are of males aged 15 to 34 yearst. Suppose you are a sociologist in Rock Springs, Wyoming, and a random sample of police files showed that of 37 arrests last month, 25 were of males aged 15 to 34 years. Use a 5% level of significance to test the claim that the population proportion of such arrests in Rock Springs is different from 70%. (a) What is the level of significance? State the null and alternate hypotheses. O Ho: p+ 0.7; H:p- 0.7 O Ho: p = 0.7; H,: p - 0.7 O Ho: p = 0.7; H,: p > 0.7 O Hoi p = 0.7; H,: p < 0.7 O Ho: p < 0.7; Hp = 0.7 (b) What sampling distribution will you use? O The standard normal, since np > 5 and ng > 5. The standard normal, since np < 5 and ng < 5. The Student's t, since np < 5 and ng < 5. The Student's t, since np > 5 and ng > 5. What is the value of the sample test statistic? (Round your answer to two decimal places.) (C) Find the P-value of the test statistic. (Round your answer to four decimal places.) Sketch the sampling distribution and show the area corresponding to the P-value. -2 -1 1 2 -2 -1 1 -2 (d) Based on your answers in parts (a) to (c), will you reject or fail to reject the null hypothesis? Are the data statistically significant at level a? O At the a = 0.05 level, we reject the null hypothesis and conclude the data are statistically significant. At the a = 0.05 level, we reject the null hypothesis and conclude the data are not statistically significant. At the a = 0.05 level, we fail to reject the null hypothesis and conclude the data are statistically significant. O At the a = 0.05 level, we fail to reject the null hypothesis and conclude the data are not statistically significant.

Holt Mcdougal Larson Pre-algebra: Student Edition 2012
1st Edition
ISBN:9780547587776
Author:HOLT MCDOUGAL
Publisher:HOLT MCDOUGAL
Chapter11: Data Analysis And Probability
Section: Chapter Questions
Problem 8CR

Related questions

Topic Video
Question
Transcribed Image Text:Is the national crime rate really going down? Some sociologists say yes! They say that the reason for the decline in crime rates in the 1980s and 1990s is demographics. It seems that the
population is aging, and older people commit fewer crimes. According to the FBI and the Justice Department, 70% of all arrests are of males aged 15 to 34 yearst. Suppose you are a
sociologist in Rock Springs, Wyoming, and a random sample of police files showed that of 37 arrests last month, 25 were of males aged 15 to 34 years. Use a 5% level of significance to
test the claim that the population proportion of such arrests in Rock Springs is different from 70%.
(a) What is the level of significance?
State the null and alternate hypotheses.
O Ho: p+ 0.7; H:p- 0.7
O Ho: p = 0.7; H,: p - 0.7
O Ho: p = 0.7; H,: p > 0.7
O Hoi p = 0.7; H,: p < 0.7
O Ho: p < 0.7; Hp = 0.7
(b) What sampling distribution will you use?
O The standard normal, since np > 5 and ng > 5.
The standard normal, since np < 5 and ng < 5.
The Student's t, since np < 5 and ng < 5.
The Student's t, since np > 5 and ng > 5.
What is the value of the sample test statistic? (Round your answer to two decimal places.)
(C) Find the P-value of the test statistic. (Round your answer to four decimal places.)
Sketch the sampling distribution and show the area corresponding to the P-value.
-2
-1
1
2
-2
-1
1
-2
(d) Based on your answers in parts (a) to (c), will you reject or fail to reject the null hypothesis? Are the data statistically significant at level a?
O At the a = 0.05 level, we reject the null hypothesis and conclude the data are statistically significant.
At the a = 0.05 level, we reject the null hypothesis and conclude the data are not statistically significant.
At the a = 0.05 level, we fail to reject the null hypothesis and conclude the data are statistically significant.
O At the a = 0.05 level, we fail to reject the null hypothesis and conclude the data are not statistically significant.
Expert Solution
This question has been solved!
Explore an expertly crafted, step-by-step solution for a thorough understanding of key concepts.

Step by step
Solved in 2 steps with 1 images

Knowledge Booster


Learn more about
Need a deep-dive on the concept behind this application? Look no further. Learn more about this topic, statistics and related others by exploring similar questions and additional content below.Recommended textbooks for you
Holt Mcdougal Larson Pre-algebra: Student Edition…
Algebra
ISBN:
9780547587776
Author:
HOLT MCDOUGAL
Publisher:
HOLT MCDOUGAL


College Algebra (MindTap Course List)
Algebra
ISBN:
9781305652231
Author:
R. David Gustafson, Jeff Hughes
Publisher:
Cengage Learning
Holt Mcdougal Larson Pre-algebra: Student Edition…
Algebra
ISBN:
9780547587776
Author:
HOLT MCDOUGAL
Publisher:
HOLT MCDOUGAL
College Algebra (MindTap Course List)
Algebra
ISBN:
9781305652231
Author:
R. David Gustafson, Jeff Hughes
Publisher:
Cengage Learning