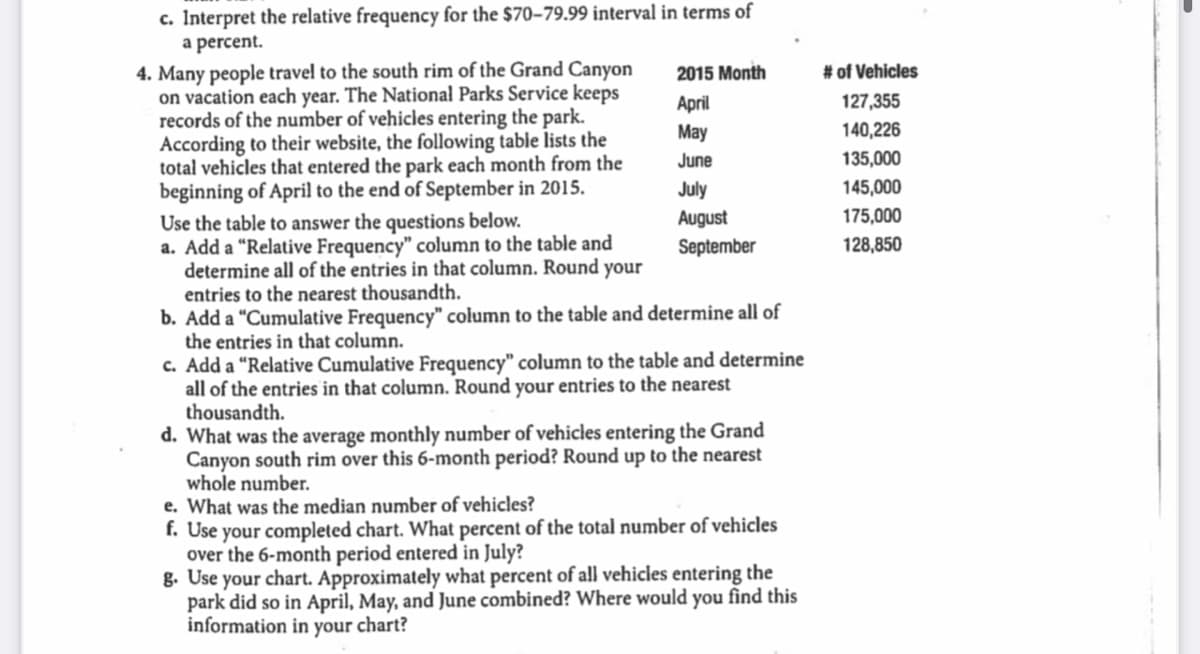
Many people travel to the south rim of the Grand Canyon on vacation each year. The National Parks Service keeps records of the number of vehicles entering the park. According to their website, the following table lists the total vehicles that entered the park each month from the beginning of April to the end of September in 2015. Use the table to answer the questions below. a. Add a "Relative Frequency" column to the table and determine all of the entries in that column. Round your entries to the nearest thousandth. b. Add a "Cumulative Frequency" column to the table and determine all of the entries in that column. 2015 Month # of Vehicles April 127,355 May 140,226 June 135,000 July 145,000 August 175,000 September 128,850 c. Add a "Relative Cumulative Frequency" column to the table and determine all of the entries in that column. Round your entries to the nearest thousandth. d. What was the average monthly number of vehicles entering the Grand Canyon south rim over this 6-month period? Round up to the nearest whole number. e. What was the median number of vehicles? f. Use your completed chart. What percent of the total number of vehicles over the 6-month period entered in July? g. Use your chart. Approximately what percent of all vehicles entering the park did so in April, May, and June combined? Where would you find this information in your chart?


Inverse Normal Distribution
The method used for finding the corresponding z-critical value in a normal distribution using the known probability is said to be an inverse normal distribution. The inverse normal distribution is a continuous probability distribution with a family of two parameters.
Mean, Median, Mode
It is a descriptive summary of a data set. It can be defined by using some of the measures. The central tendencies do not provide information regarding individual data from the dataset. However, they give a summary of the data set. The central tendency or measure of central tendency is a central or typical value for a probability distribution.
Z-Scores
A z-score is a unit of measurement used in statistics to describe the position of a raw score in terms of its distance from the mean, measured with reference to standard deviation from the mean. Z-scores are useful in statistics because they allow comparison between two scores that belong to different normal distributions.


Trending now
This is a popular solution!

Step by step
Solved in 4 steps with 5 images


