Mark Gershon, owner of a musical instrument distributorship, thinks that demand for guitars may be related to the number of television appearances by the popular group Maroon 5 during the previous month. Gershon has collected the data shown in the following table: Maroon 5 TV Appearances Demand for Guitars 3 3 6 7 8 6 6 6 59 7 3 This exercise contains only parts b, c, and d. b) Using the least-squares regression method, the equation for forecasting is (round your responses to four decimal places): Y-O+Dx
Mark Gershon, owner of a musical instrument distributorship, thinks that demand for guitars may be related to the number of television appearances by the popular group Maroon 5 during the previous month. Gershon has collected the data shown in the following table: Maroon 5 TV Appearances Demand for Guitars 3 3 6 7 8 6 6 6 59 7 3 This exercise contains only parts b, c, and d. b) Using the least-squares regression method, the equation for forecasting is (round your responses to four decimal places): Y-O+Dx

Practical Management Science
6th Edition
ISBN:9781337406659
Author:WINSTON, Wayne L.
Publisher:WINSTON, Wayne L.
Chapter13: Regression And Forecasting Models
Section: Chapter Questions
Problem 33P: Management of a home appliance store would like to understand the growth pattern of the monthly...

Related questions
Question
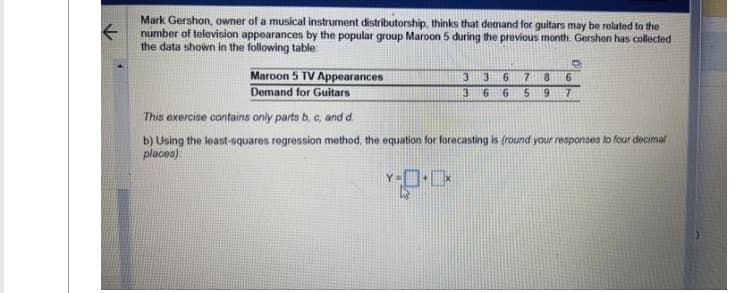
Transcribed Image Text:Mark Gershon, owner of a musical instrument distributorship, thinks that demand for guitars may be related to the
number of television appearances by the popular group Maroon 5 during the previous month. Gershon has collected
the data shown in the following table
Maroon 5 TV Appearances
Demand for Guitars
3 3
3 6 6
6 7 8 6
5 9 7
-0.0
This exercise contains only parts b, c, and d.
b) Using the least-squares regression method, the equation for forecasting is (round your responses to four decimal
places):
Expert Solution
This question has been solved!
Explore an expertly crafted, step-by-step solution for a thorough understanding of key concepts.

This is a popular solution!

Trending now
This is a popular solution!

Step by step
Solved in 3 steps

Recommended textbooks for you
Practical Management Science
Operations Management
ISBN:
9781337406659
Author:
WINSTON, Wayne L.
Publisher:
Cengage,

Contemporary Marketing
Marketing
ISBN:
9780357033777
Author:
Louis E. Boone, David L. Kurtz
Publisher:
Cengage Learning
Practical Management Science
Operations Management
ISBN:
9781337406659
Author:
WINSTON, Wayne L.
Publisher:
Cengage,
Contemporary Marketing
Marketing
ISBN:
9780357033777
Author:
Louis E. Boone, David L. Kurtz
Publisher:
Cengage Learning