Marketing research has indicated that males and females may have different color preferences in visual advertising with males preferring brighter colors and females preferring softer tones. To test this theory, researchers surveyed females and males by asking them to rate two different visual advertisements for clothing items with the first ad primarily having bright red and blue lettering and graphics and the second primarily having pastel blue and yellow lettering and graphics. The results were as follows. Preferred Bright Blue and Red Preferred Pastel Blue and Yellow Total Males 85 50 135 Females 65 80 145 Researchers suggested that males would be more likely to prefer the brighter colors than females. (a) If p1 represents the true proportion of males that prefer brighter colors in advertisements, and p2 represents the true proportion of females that prefer brighter colors in advertisements, state the appropriate null and alternative hypotheses for this study. H0: p1 ? < = > ≠ p2 Ha: p1 ? < = > ≠ p2 (b) Calculate the test statistic. (Round your answer to two decimal places.) (c) Find the P-value for this data. (Use a table or SALT. Round your answer to four decimal places.) (d) Based on ? = 0.01, what is the appropriate conclusion for the hypothesis test? Reject the null hypothesis.Fail to reject the null hypothesis. Accept the null hypothesis.Fail to accept the null hypothesis.
Marketing research has indicated that males and females may have different color preferences in visual advertising with males preferring brighter colors and females preferring softer tones. To test this theory, researchers surveyed females and males by asking them to rate two different visual advertisements for clothing items with the first ad primarily having bright red and blue lettering and graphics and the second primarily having pastel blue and yellow lettering and graphics. The results were as follows. Preferred Bright Blue and Red Preferred Pastel Blue and Yellow Total Males 85 50 135 Females 65 80 145 Researchers suggested that males would be more likely to prefer the brighter colors than females. (a) If p1 represents the true proportion of males that prefer brighter colors in advertisements, and p2 represents the true proportion of females that prefer brighter colors in advertisements, state the appropriate null and alternative hypotheses for this study. H0: p1 ? < = > ≠ p2 Ha: p1 ? < = > ≠ p2 (b) Calculate the test statistic. (Round your answer to two decimal places.) (c) Find the P-value for this data. (Use a table or SALT. Round your answer to four decimal places.) (d) Based on ? = 0.01, what is the appropriate conclusion for the hypothesis test? Reject the null hypothesis.Fail to reject the null hypothesis. Accept the null hypothesis.Fail to accept the null hypothesis.

Glencoe Algebra 1, Student Edition, 9780079039897, 0079039898, 2018
18th Edition
ISBN:9780079039897
Author:Carter
Publisher:Carter
Chapter10: Statistics
Section10.6: Summarizing Categorical Data
Problem 27PPS

Related questions

Question
Marketing research has indicated that males and females may have different color preferences in visual advertising with males preferring brighter colors and females preferring softer tones. To test this theory, researchers surveyed females and males by asking them to rate two different visual advertisements for clothing items with the first ad primarily having bright red and blue lettering and graphics and the second primarily having pastel blue and yellow lettering and graphics. The results were as follows.
| Preferred Bright Blue and Red |
Preferred Pastel Blue and Yellow |
Total | |
|---|---|---|---|
| Males | 85 | 50 | 135 |
| Females | 65 | 80 | 145 |
Researchers suggested that males would be more likely to prefer the brighter colors than females.
(a)
If p1 represents the true proportion of males that prefer brighter colors in advertisements, and p2 represents the true proportion of females that prefer brighter colors in advertisements, state the appropriate null and alternative hypotheses for this study.
H0: p1
? < = > ≠
p2
Ha: p1
? < = > ≠
p2
(b)
Calculate the test statistic. (Round your answer to two decimal places.)
(c)
Find the P-value for this data. (Use a table or SALT. Round your answer to four decimal places.)
(d)
Based on
? = 0.01,
what is the appropriate conclusion for the hypothesis test?Reject the null hypothesis.Fail to reject the null hypothesis. Accept the null hypothesis.Fail to accept the null hypothesis.
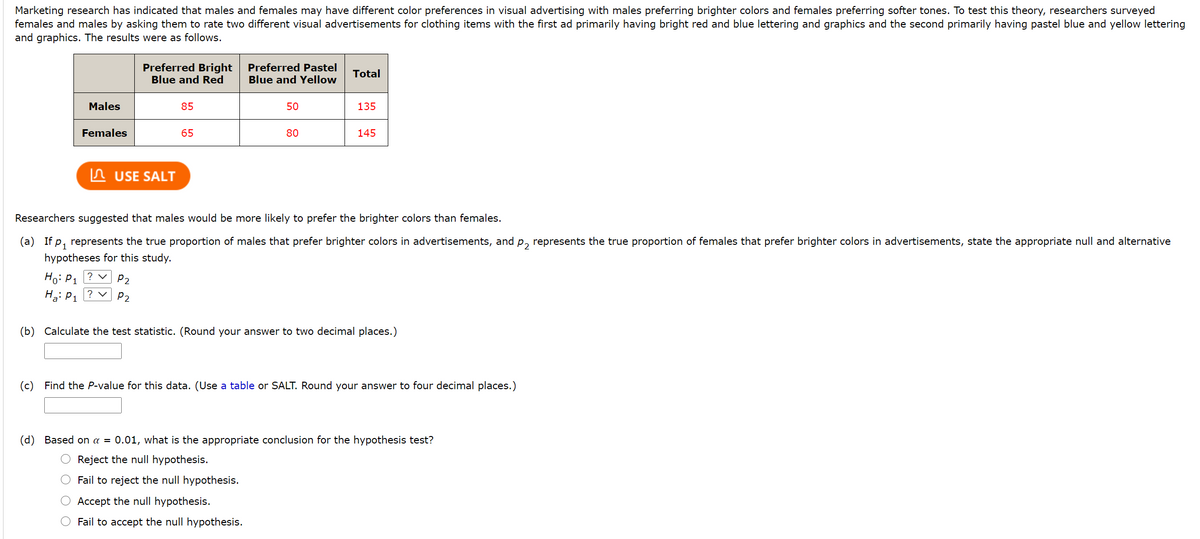
Transcribed Image Text:Marketing research has indicated that males and females may have different color preferences in visual advertising with males preferring brighter colors and females preferring softer tones. To test this theory, researchers surveyed
females and males by asking them to rate two different visual advertisements for clothing items with the first ad primarily having bright red and blue lettering and graphics and the second primarily having pastel blue and yellow lettering
and graphics. The results were as follows.
Preferred Bright
Blue and Red
Preferred Pastel
Blue and Yellow
Total
Males
85
50
135
Females
65
80
145
n USE SALT
Researchers suggested that males would be more likely to prefer the brighter colors than females.
(a) If p, represents the true proportion of males that prefer brighter colors in advertisements, and p, represents the true proportion of females that prefer brighter colors in advertisements, state the appropriate null and alternative
hypotheses for this study.
Ho: P1 ? v
Ha: P1 ? v
P2
P2
(b) Calculate the test statistic. (Round your answer to two decimal places.)
(c) Find the P-value for this data. (Use a table or SALT. Round your answer to four decimal places.)
(d) Based on a = 0.01, what is the appropriate conclusion for the hypothesis test?
Reject the null hypothesis.
Fail to reject the null hypothesis.
Accept the null hypothesis.
Fail to accept the null hypothesis.
Expert Solution
This question has been solved!
Explore an expertly crafted, step-by-step solution for a thorough understanding of key concepts.

This is a popular solution!

Trending now
This is a popular solution!

Step by step
Solved in 3 steps

Knowledge Booster


Learn more about
Need a deep-dive on the concept behind this application? Look no further. Learn more about this topic, statistics and related others by exploring similar questions and additional content below.Recommended textbooks for you
Glencoe Algebra 1, Student Edition, 9780079039897…
Algebra
ISBN:
9780079039897
Author:
Carter
Publisher:
McGraw Hill
Glencoe Algebra 1, Student Edition, 9780079039897…
Algebra
ISBN:
9780079039897
Author:
Carter
Publisher:
McGraw Hill