Mass of aspirin used is .090 g the absorbance for the final solution was .304 nm Slope is 1708 and y-intercept is -0.03397 what is the molarity of the final unknown solution and the molarity of the original solution made from aspirin in the 250.0 ml flask
Mass of aspirin used is .090 g the absorbance for the final solution was .304 nm Slope is 1708 and y-intercept is -0.03397 what is the molarity of the final unknown solution and the molarity of the original solution made from aspirin in the 250.0 ml flask

Chapter16: Applications Of Neutralization Titrations
Section: Chapter Questions
Problem 16.18QAP

Related questions
Question
Mass of aspirin used is .090 g
the absorbance for the final solution was .304 nm
Slope is 1708 and y-intercept is -0.03397
what is the molarity of the final unknown solution and the molarity of the original solution made from aspirin in the 250.0 ml flask
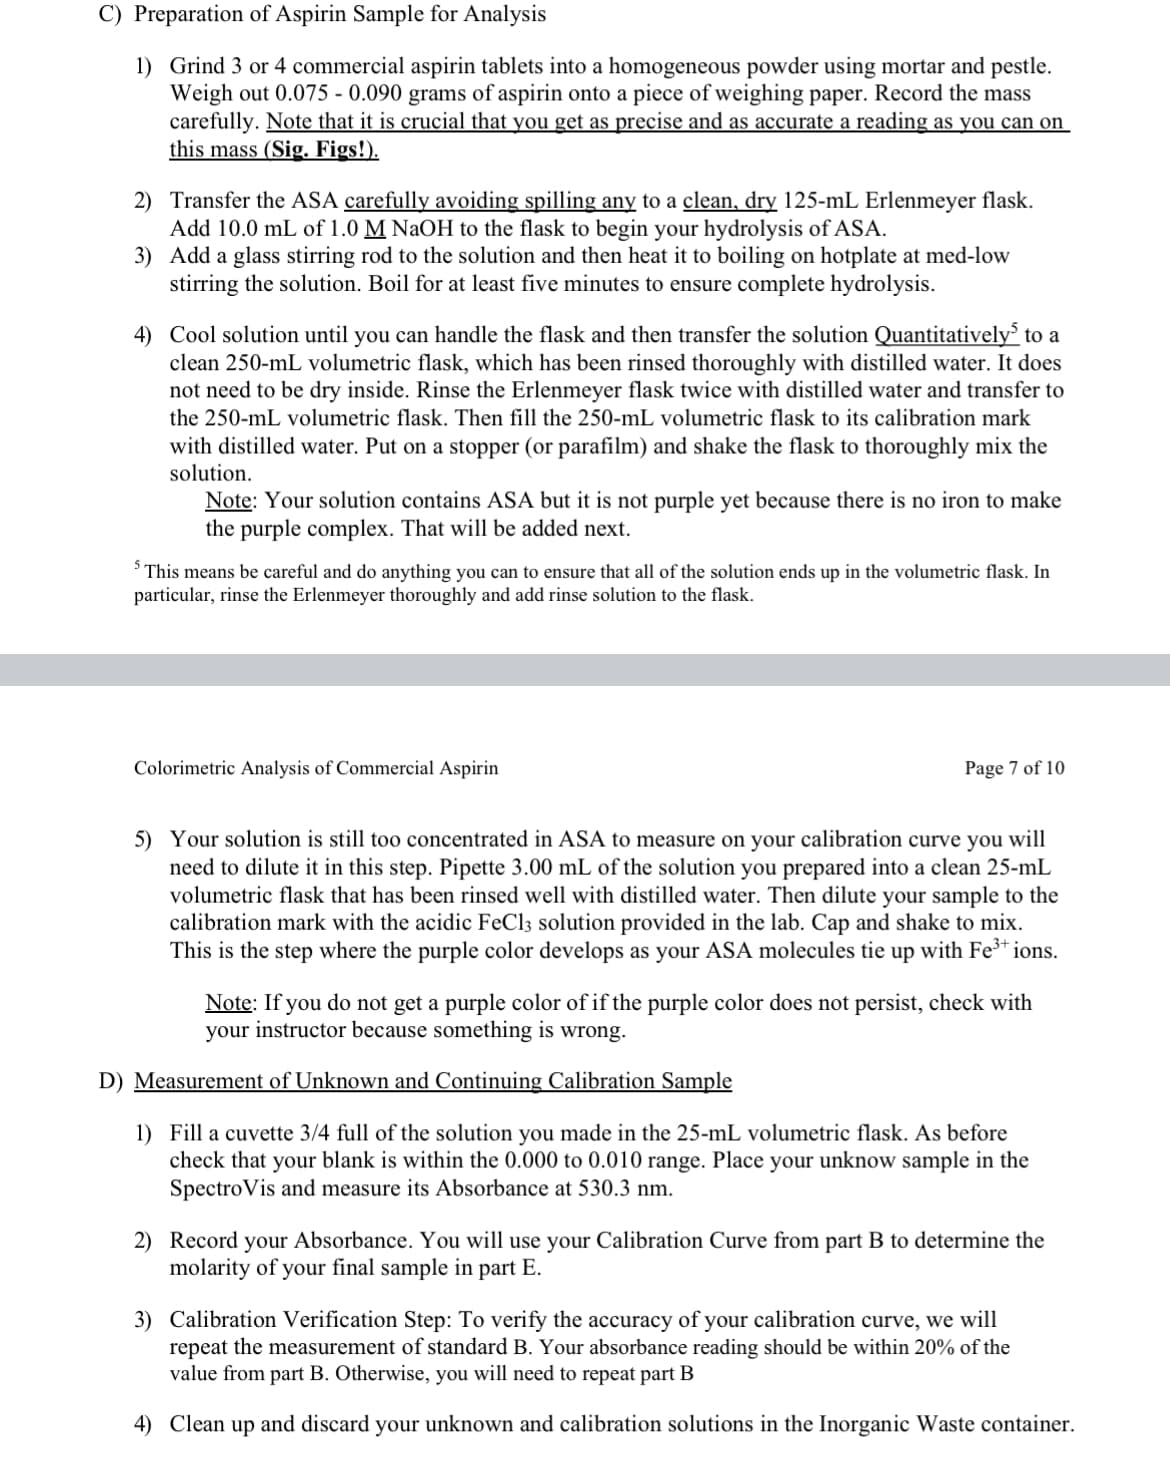
Transcribed Image Text:C) Preparation of Aspirin Sample for Analysis
1) Grind 3 or 4 commercial aspirin tablets into a homogeneous powder using mortar and pestle.
Weigh out 0.075 - 0.090 grams of aspirin onto a piece of weighing paper. Record the mass
carefully. Note that it is crucial that you get as precise and as accurate a reading as you can on
this mass (Sig. Figs!).
2) Transfer the ASA carefully avoiding spilling any to a clean, dry 125-mL Erlenmeyer flask.
Add 10.0 mL of 1.0 M NaOH to the flask to begin your hydrolysis of ASA.
3) Add a glass stirring rod to the solution and then heat it to boiling on hotplate at med-low
stirring the solution. Boil for at least five minutes to ensure complete hydrolysis.
4) Cool solution until you can handle the flask and then transfer the solution Quantitatively to a
clean 250-mL volumetric flask, which has been rinsed thoroughly with distilled water. It does
not need to be dry inside. Rinse the Erlenmeyer flask twice with distilled water and transfer to
the 250-mL volumetric flask. Then fill the 250-mL volumetric flask to its calibration mark
with distilled water. Put on a stopper (or parafilm) and shake the flask to thoroughly mix the
solution.
Note: Your solution contains ASA but it is not purple yet because there is no iron to make
the purple complex. That will be added next.
5 This means be careful and do anything you can to ensure that all of the solution ends up in the volumetric flask. In
particular, rinse the Erlenmeyer thoroughly and add rinse solution to the flask.
Colorimetric Analysis of Commercial Aspirin
Page 7 of 10
5) Your solution is still too concentrated in ASA to measure on your calibration curve you will
need to dilute it in this step. Pipette 3.00 mL of the solution you prepared into a clean 25-mL
volumetric flask that has been rinsed well with distilled water. Then dilute your sample to the
calibration mark with the acidic FeCl3 solution provided in the lab. Cap and shake to mix.
This is the step where the purple color develops as your ASA molecules tie up with Fe³* ions.
Note: If you do not get a purple color of if the purple color does not persist, check with
your instructor because something is wrong.
D) Measurement of Unknown and Continuing Calibration Sample
1) Fill a cuvette 3/4 full of the solution you made in the 25-mL volumetric flask. As before
check that your blank is within the 0.000 to 0.010 range. Place your unknow sample in the
SpectroVis and measure its Absorbance at 530.3 nm.
2) Record your Absorbance. You will use your Calibration Curve from part B to determine the
molarity of your final sample in part E.
3) Calibration Verification Step: To verify the accuracy of your calibration curve, we will
repeat the measurement of standard B. Your absorbance reading should be within 20% of the
value from part B. Otherwise, you will need to repeat part B
4) Clean up and discard your unknown and calibration solutions in the Inorganic Waste container.
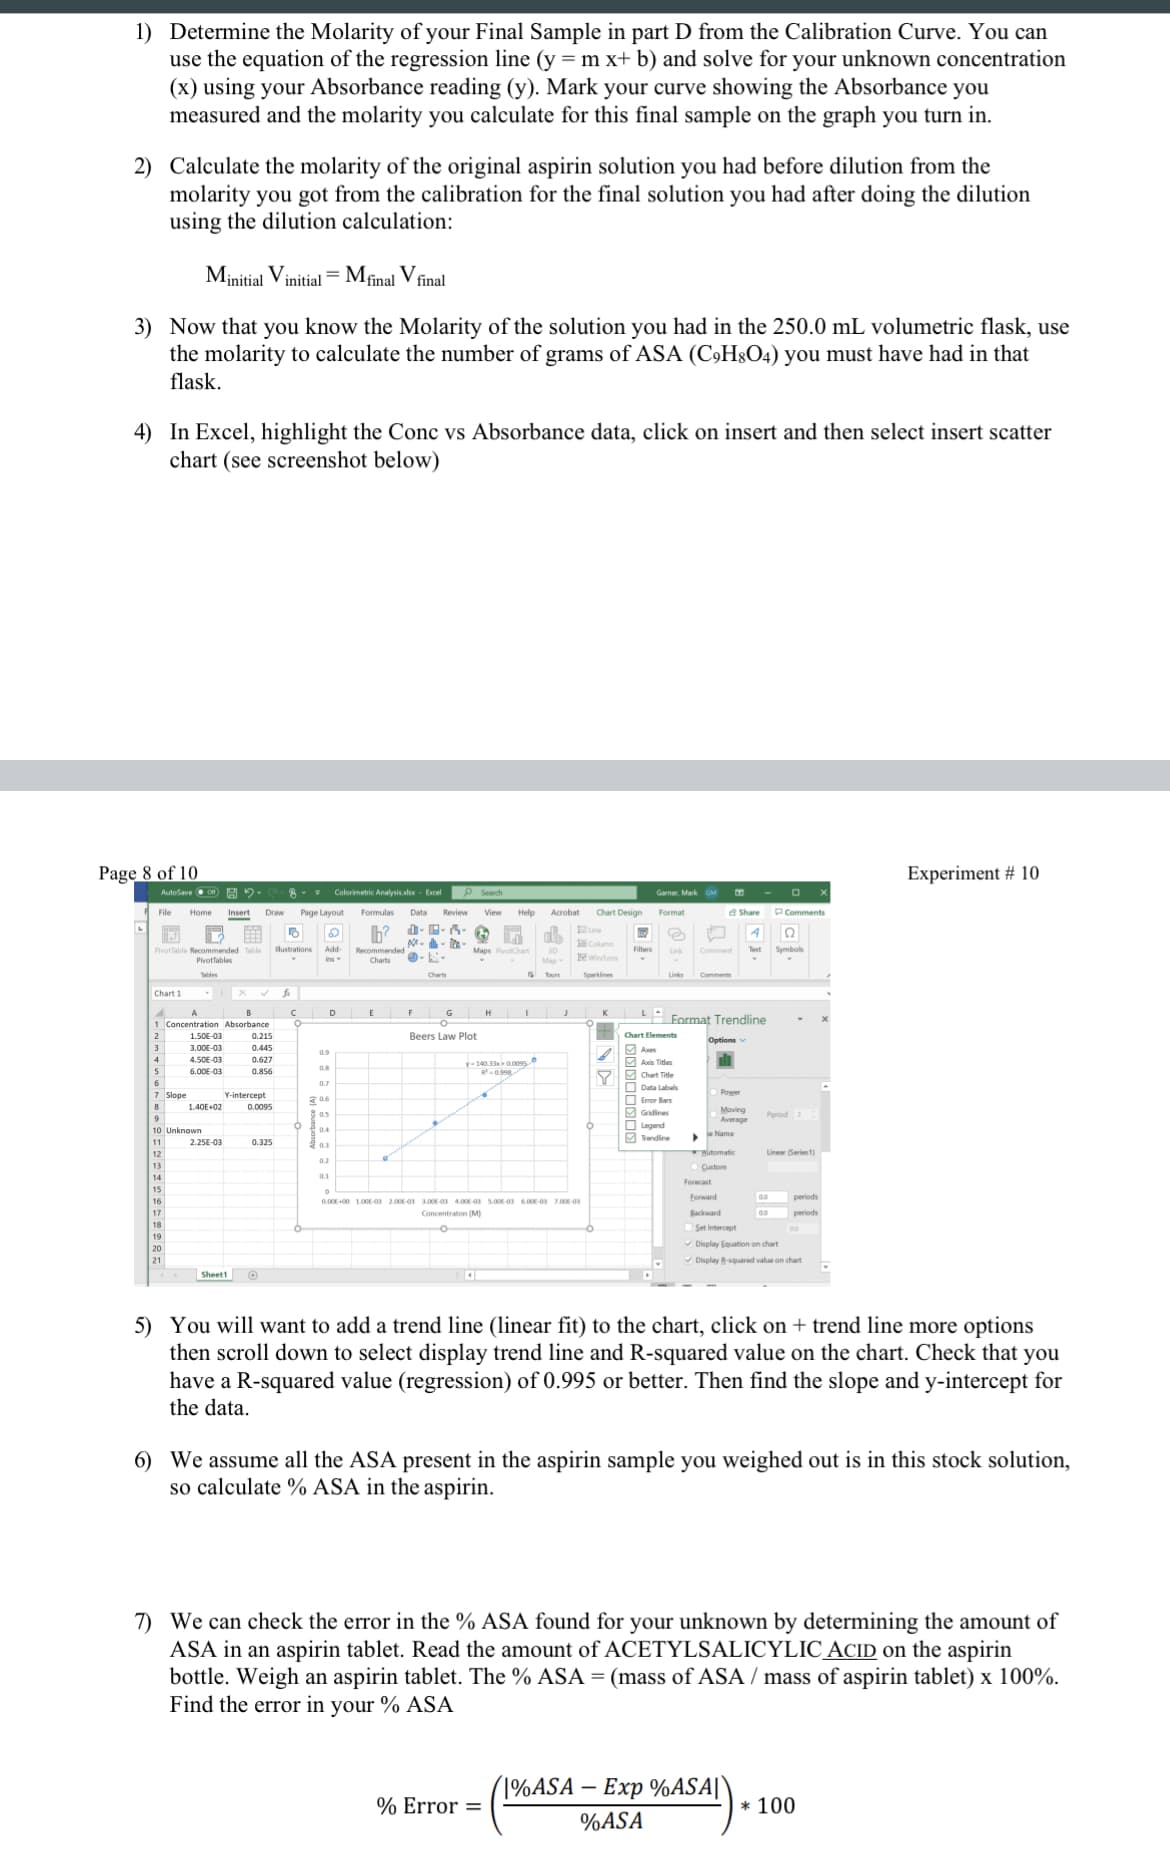
Transcribed Image Text:1) Determine the Molarity of your Final Sample in part D from the Calibration Curve. You can
use the equation of the regression line (y = m x+ b) and solve for your unknown concentration
(x) using your Absorbance reading (y). Mark your curve showing the Absorbance you
measured and the molarity you calculate for this final sample on the graph you turn in.
2) Calculate the molarity of the original aspirin solution you had before dilution from the
molarity you got from the calibration for the final solution you had after doing the dilution
using the dilution calculation:
Minitial Vinitial = Mfinal V final
3) Now that you know the Molarity of the solution you had in the 250.0 mL volumetric flask, use
the molarity to calculate the number of grams of ASA (C,H8O4) you must have had in that
flask.
4) In Excel, highlight the Conc vs Absorbance data, click on insert and then select insert scatter
chart (see screenshot below)
Page 8 of 10
iment # 10
AutoSave eon
Colorimetric Analysis.alx- Excel
P Search
Garner, Mark GM
Home
Page Layout
Data
Review
View
Help
Acrobat
Chart Design
Format
PComments
Insert
- - i-
Symboks
Pivottable Recommended Table
Pivottables
Ilustrations
Add-
Text
Wirytoss
ins
Charts
Tbles
Charts
Tours
Chart 1
D
H
1 Concentration Absorbance
Format Trendline
2
1.50E-03
0.215
Beers Law Plot
Chart Elements
Options
3.00E-03
0.445
Axes
0.9
4.50E-03
0.627
y-140.330oos
6.00E-03
0.856
R-0.998
6
0.7
7 Slope
Y-intercept
O Error Bars
8
1.40E+02
0.0095
Moving
Average
Period 2
O Legend
M Tendine
10 Unknown
e Name
11
2.25E-03
0.325
0.3
tomatic
Linear (Series1)
12
0.2
13
Custom
14
0.1
Forecast
15
Forward
periods
0.00 00 1.00E-0 2.00-0 3.00E-0 4.00-0 5.00-0 6.00-03 7.00-03
17
Concentraton (M)
Backward
periods
18
OSet Intercept
19
V Display Equation on chart
21
V Display 8squared value on chart
Sheett
5) You will want to add a trend line (linear fit) to the chart, click on + trend line more options
then scroll down to select display trend line and R-squared value on the chart. Check that you
have a R-squared value (regression) of 0.995 or better. Then find the slope and y-intercept for
the data.
6) We assume all the ASA present in the aspirin sample you weighed out is in this stock solution,
so calculate % ASA in the aspirin.
7) We can check the error in the % ASA found for your unknown by determining the amount of
ASA in an aspirin tablet. Read the amount ofACETYLSALICYLIC_ACID on the aspirin
bottle. Weigh an aspirin tablet. The % ASA = (mass of ASA / mass of aspirin tablet) x 100%.
Find the error in your % ASA
(1%ASA – Exp %ASA||
-
% Error =
* 100
%ASA
Expert Solution
This question has been solved!
Explore an expertly crafted, step-by-step solution for a thorough understanding of key concepts.

Step by step
Solved in 4 steps

Knowledge Booster


Learn more about
Need a deep-dive on the concept behind this application? Look no further. Learn more about this topic, chemistry and related others by exploring similar questions and additional content below.Recommended textbooks for you