Match each graph with the function it best represents-a demand function, a revenue function, a cost function, or a profit function. Explain your reasoning. y 35,000 a 30,000 25,000 b. 20,000 15,000 10,000 5,000 d 1,000 2,000 3,000 4,000 5,000 6,000 7,000 8,000 9,000 Graph a is the cost X function. number of units sold decreases as the price increases Graph b is the revenue X function. This function increases linearly with the number of units produced. Graph c is the demand X and graph d is the revenue cost X function is less than a cost X function.
Match each graph with the function it best represents-a demand function, a revenue function, a cost function, or a profit function. Explain your reasoning. y 35,000 a 30,000 25,000 b. 20,000 15,000 10,000 5,000 d 1,000 2,000 3,000 4,000 5,000 6,000 7,000 8,000 9,000 Graph a is the cost X function. number of units sold decreases as the price increases Graph b is the revenue X function. This function increases linearly with the number of units produced. Graph c is the demand X and graph d is the revenue cost X function is less than a cost X function.

Managerial Economics: Applications, Strategies and Tactics (MindTap Course List)
14th Edition
ISBN:9781305506381
Author:James R. McGuigan, R. Charles Moyer, Frederick H.deB. Harris
Publisher:James R. McGuigan, R. Charles Moyer, Frederick H.deB. Harris
Chapter11: Price And Output Determination: Monopoly And Dominant Firms
Section: Chapter Questions
Problem 3E

Related questions

Question
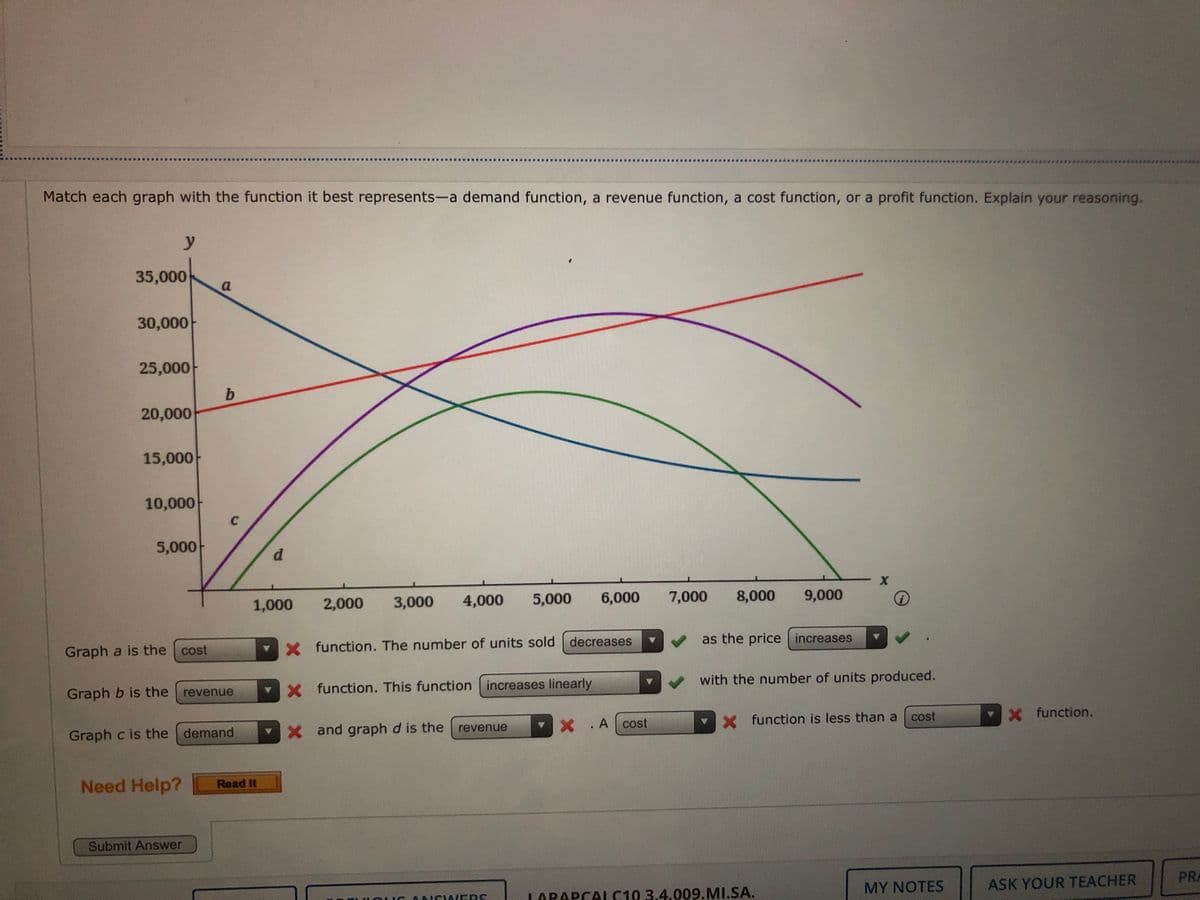
Transcribed Image Text:Match each graph with the function it best represents-a demand function, a revenue function, a cost function, or a profit function. Explain your reasoning.
y
35,000
30,000
25,000
b.
20,000
15,000-
10,000
5,000
d.
1,000
2,000
3,000
4,000
5,000
6,000
7,000
8,000
9,000
Graph a is the cost
VX function. The number of units sold decreases
as the price increases
Graph b is the revenue
function. This function increases linearly
V with the number of units produced.
Graph c is the demand
x and graph d is the revenue
A cost
X function is less than a cost
X function.
Need Help?
Read It
Submit Answer
LARAPCALC10 3.4.009.MI.SA.
MY NOTES
ASK YOUR TEACHER
PRA
Expert Solution
This question has been solved!
Explore an expertly crafted, step-by-step solution for a thorough understanding of key concepts.

This is a popular solution!

Trending now
This is a popular solution!

Step by step
Solved in 2 steps

Knowledge Booster


Learn more about
Need a deep-dive on the concept behind this application? Look no further. Learn more about this topic, economics and related others by exploring similar questions and additional content below.Recommended textbooks for you
Managerial Economics: Applications, Strategies an…
Economics
ISBN:
9781305506381
Author:
James R. McGuigan, R. Charles Moyer, Frederick H.deB. Harris
Publisher:
Cengage Learning


Managerial Economics: Applications, Strategies an…
Economics
ISBN:
9781305506381
Author:
James R. McGuigan, R. Charles Moyer, Frederick H.deB. Harris
Publisher:
Cengage Learning

Essentials of Economics (MindTap Course List)
Economics
ISBN:
9781337091992
Author:
N. Gregory Mankiw
Publisher:
Cengage Learning

Principles of Microeconomics (MindTap Course List)
Economics
ISBN:
9781305971493
Author:
N. Gregory Mankiw
Publisher:
Cengage Learning