The figure shows graphs of the total cost function and the total revenue function for a commodity. (Assume cost and revenue are measured in dollars.) y 500 400 300 B 200 100 10 20 30 40 50 60 (a) Label each function correctly. total revenue function v function A function B total cost function (b) Determine the fixed costs. $ 200 (c) Locate the break-even point. (x, y) = -(| 40,300 Determine the number of units sold to break even. X units (d) Estimate the marginal cost MC and marginal revenue MR. MC = MR =
The figure shows graphs of the total cost function and the total revenue function for a commodity. (Assume cost and revenue are measured in dollars.) y 500 400 300 B 200 100 10 20 30 40 50 60 (a) Label each function correctly. total revenue function v function A function B total cost function (b) Determine the fixed costs. $ 200 (c) Locate the break-even point. (x, y) = -(| 40,300 Determine the number of units sold to break even. X units (d) Estimate the marginal cost MC and marginal revenue MR. MC = MR =

Chapter6: Proudction Costs
Section: Chapter Questions
Problem 8SQP

Related questions
Question
100%
Hello,
attached would be the problem I need help with.
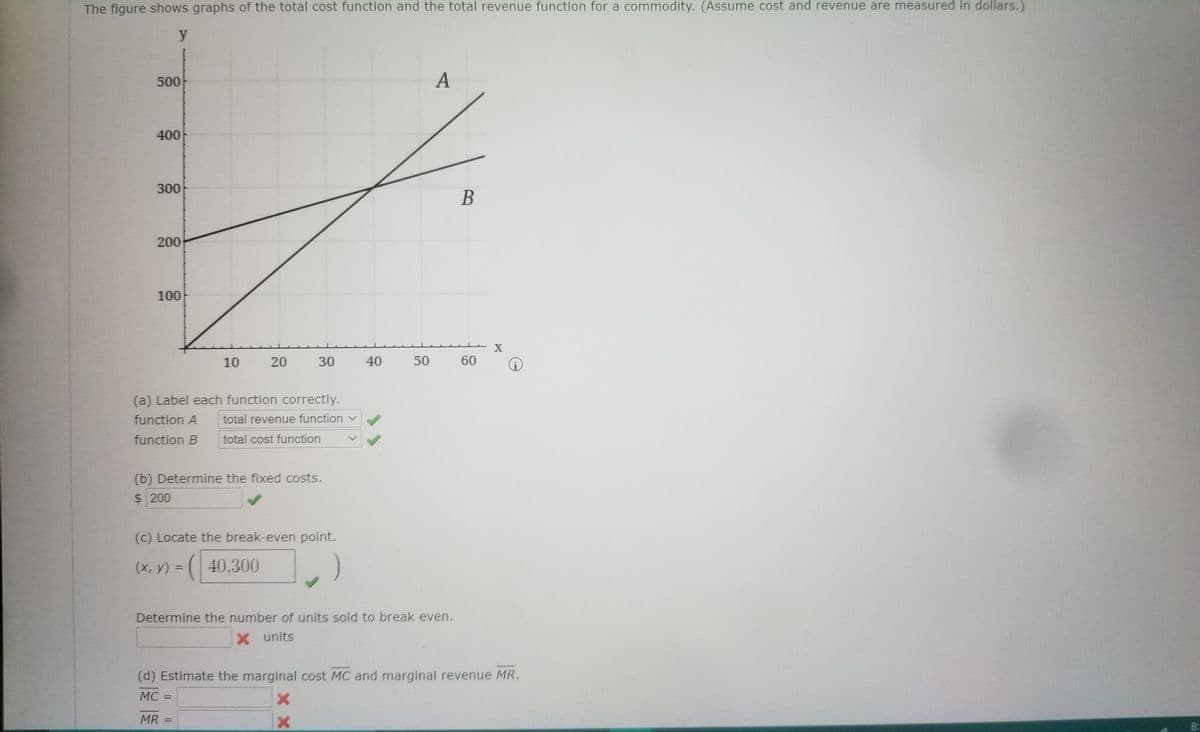
Transcribed Image Text:The figure shows graphs of the total cost function and the total revenue function for a commodity. (Assume cost and revenue are measured in dollars.)
500
A
400
300
B
200
100
X
10
20
30
40
50
60
(a) Label each function correctly.
function A
total revenue function v
function B
total cost function
(b) Determine the fixed costs.
$200
(c) Locate the break-even point.
(х, у) %3D
(| 40,300
Determine the number of units sold to break even.
X units
(d) Estimate the marginal cost MC and marginal revenue MR.
MC
%D
MR =
Expert Solution
This question has been solved!
Explore an expertly crafted, step-by-step solution for a thorough understanding of key concepts.

This is a popular solution!

Trending now
This is a popular solution!

Step by step
Solved in 2 steps

Recommended textbooks for you


Managerial Economics: Applications, Strategies an…
Economics
ISBN:
9781305506381
Author:
James R. McGuigan, R. Charles Moyer, Frederick H.deB. Harris
Publisher:
Cengage Learning
Managerial Economics: Applications, Strategies an…
Economics
ISBN:
9781305506381
Author:
James R. McGuigan, R. Charles Moyer, Frederick H.deB. Harris
Publisher:
Cengage Learning

Managerial Economics: A Problem Solving Approach
Economics
ISBN:
9781337106665
Author:
Luke M. Froeb, Brian T. McCann, Michael R. Ward, Mike Shor
Publisher:
Cengage Learning
