Match each scatterplot with its corresponding correlation coefficient: A) 15 B) 15 10 10 5 3 6 12 3 12 C) 15 D) 15 10 10 3 6 12 3 6 9 12 15) r = -0.90 _16) r = 0.67 17) r= 0.91 18) r= -0.67 in
Match each scatterplot with its corresponding correlation coefficient: A) 15 B) 15 10 10 5 3 6 12 3 12 C) 15 D) 15 10 10 3 6 12 3 6 9 12 15) r = -0.90 _16) r = 0.67 17) r= 0.91 18) r= -0.67 in

Algebra & Trigonometry with Analytic Geometry
13th Edition
ISBN:9781133382119
Author:Swokowski
Publisher:Swokowski
Chapter10: Sequences, Series, And Probability
Section10.8: Probability
Problem 31E

Related questions
Topic Video
Question
please helppp
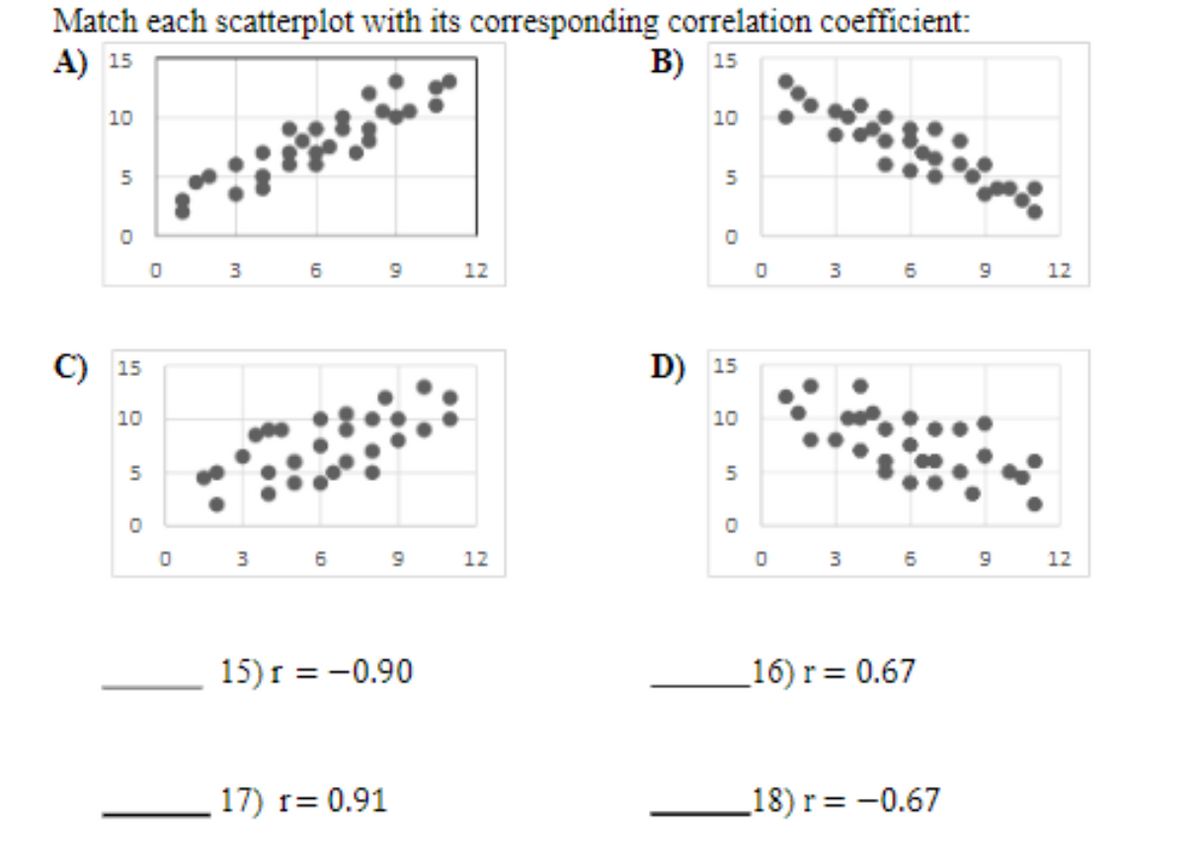
Transcribed Image Text:Match each scatterplot with its corresponding correlation coefficient:
A) 15
В) 15
10
10
5
6 9 12
3
6
12
С) 15
D) 15
10
10
5
3 6
12
3.
12
15) r = -0.90
_16) r= 0.67
17) r= 0.91
_18) r= -0.67
in
Expert Solution
This question has been solved!
Explore an expertly crafted, step-by-step solution for a thorough understanding of key concepts.

This is a popular solution!

Trending now
This is a popular solution!

Step by step
Solved in 3 steps

Knowledge Booster


Learn more about
Need a deep-dive on the concept behind this application? Look no further. Learn more about this topic, statistics and related others by exploring similar questions and additional content below.Recommended textbooks for you
Algebra & Trigonometry with Analytic Geometry
Algebra
ISBN:
9781133382119
Author:
Swokowski
Publisher:
Cengage
Algebra & Trigonometry with Analytic Geometry
Algebra
ISBN:
9781133382119
Author:
Swokowski
Publisher:
Cengage