Match the appropriate boxplot to cach histogram. Height distribution - U.S. adults of age 18-20 Answer Bank 200 150 100 50 60 70 75 Height (inches) Birth weight distribution of U.S. children 2500 2000 1500 1000 500 50 100 I50 200 Birth weight (ounces) Age distribution of flu shot recipients - U.S. adults in the Northeast over age 50 250 200 150 100 50 50 55 60 65 70 75 80 Age (years) kouarbag Kouonbaag Kouanbai
Match the appropriate boxplot to cach histogram. Height distribution - U.S. adults of age 18-20 Answer Bank 200 150 100 50 60 70 75 Height (inches) Birth weight distribution of U.S. children 2500 2000 1500 1000 500 50 100 I50 200 Birth weight (ounces) Age distribution of flu shot recipients - U.S. adults in the Northeast over age 50 250 200 150 100 50 50 55 60 65 70 75 80 Age (years) kouarbag Kouonbaag Kouanbai

Glencoe Algebra 1, Student Edition, 9780079039897, 0079039898, 2018
18th Edition
ISBN:9780079039897
Author:Carter
Publisher:Carter
Chapter10: Statistics
Section10.4: Distributions Of Data
Problem 19PFA

Related questions

Question
Can you Match the appropriate box plot to each histogram?
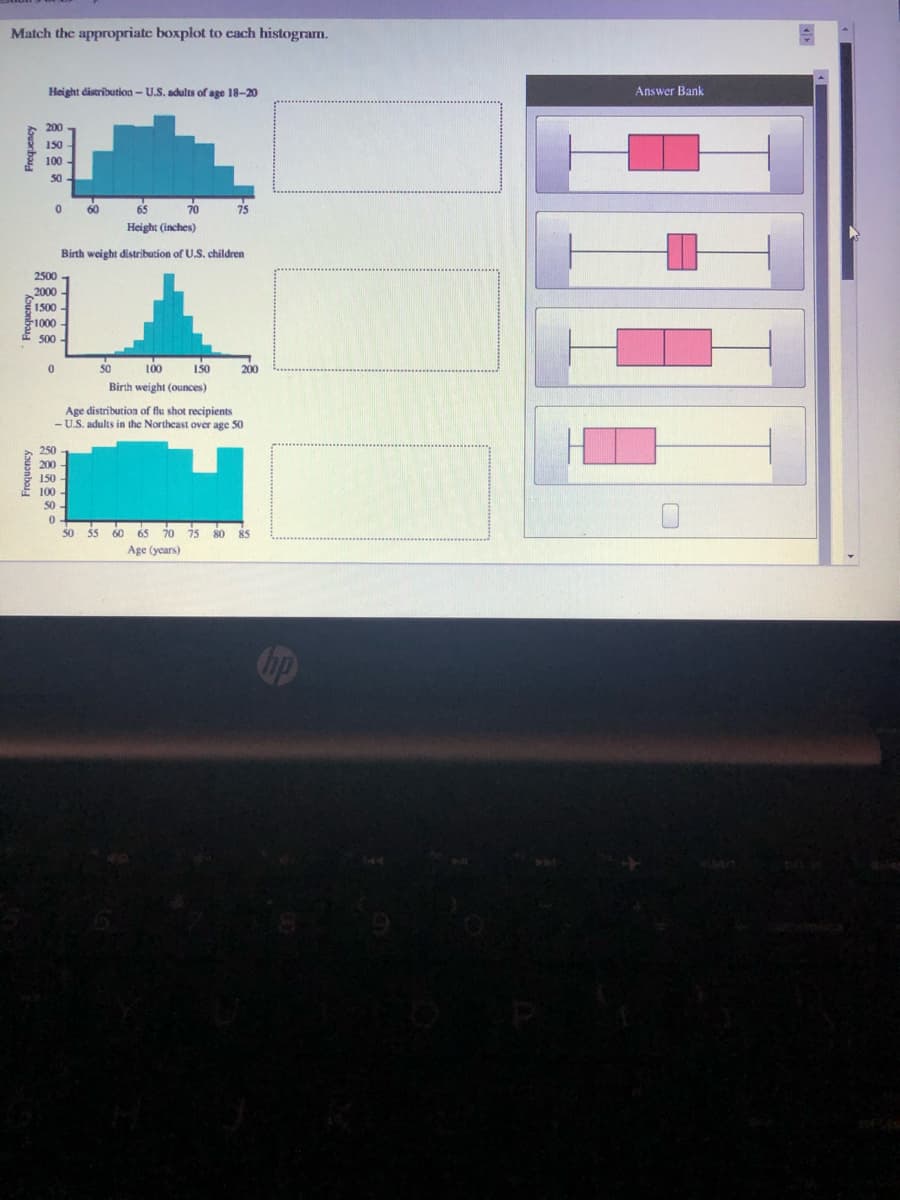
Transcribed Image Text:Match the appropriate boxplot to cach histogram.
Height distribution - U.S. adults of age 18-20
Answer Bank
200
150
100
50
60
75
Height (inches)
Birth weight distribution of U.S. children
2500
2000
1500 -
1000 -
500
100
150
200
Birth weight (ounces)
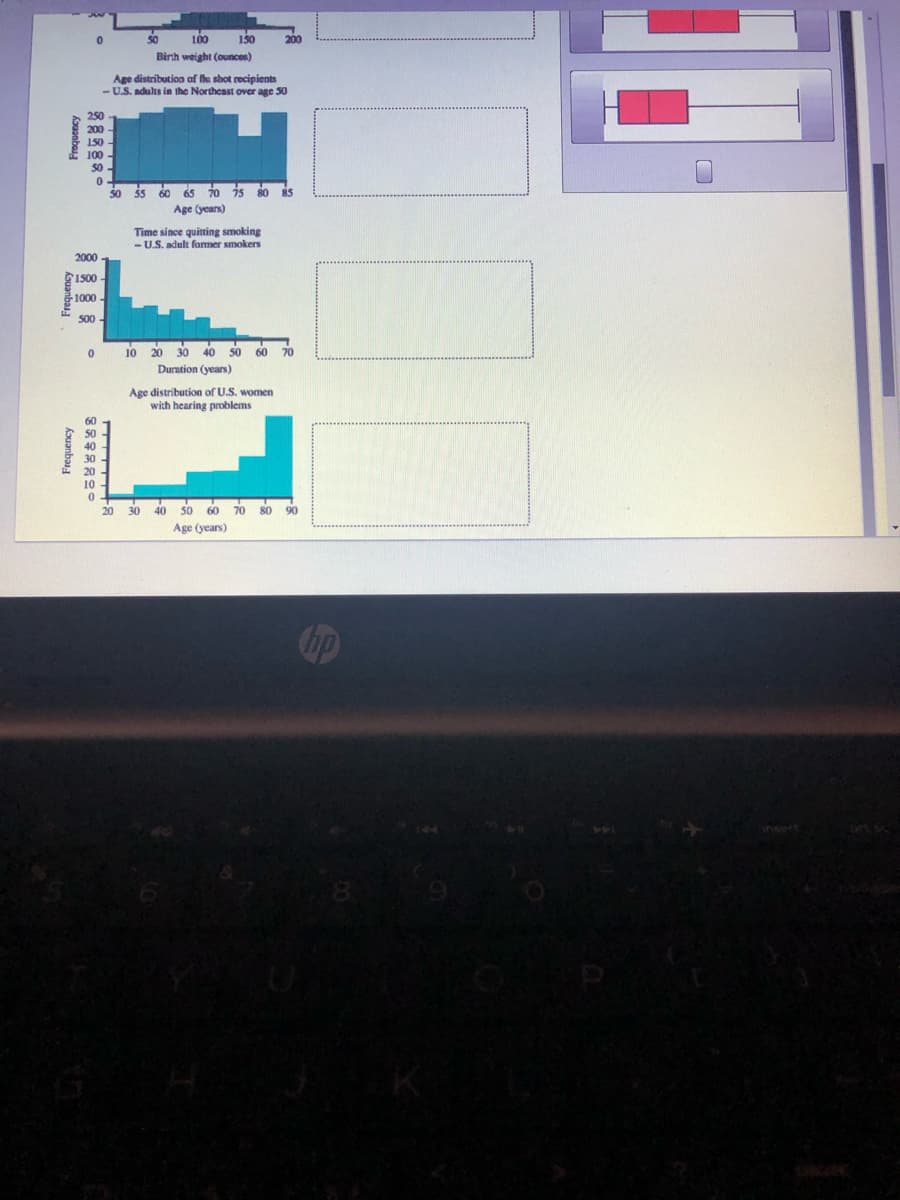
Age distribution of flu shot recipients
U.S. adults in the Northeast over age 50
250
200
150
100
50 -
50 55 60
65 70
80 85
Age (years)
Frequency
Frequency
Frequency
Transcribed Image Text:100
150
200
Birh weight (ounces)
Age distribution of Be shot recipients
- U.S. adults in the Northeast over age 50
250
200
150 -
100
so -
so 55 60 65 20 15 8o
85
Age (years)
Time since quitting smoking
-U.S. adult fomer smokers
2000
1500
1000-
500 -
10
20
30
40
50 60
70
Duration (years)
Age distribution of U.S. women
with hearing problems
60
20
30
50
60
70
80
90
Age (years)
Gip
Frequency
Expert Solution
This question has been solved!
Explore an expertly crafted, step-by-step solution for a thorough understanding of key concepts.

This is a popular solution!

Trending now
This is a popular solution!

Step by step
Solved in 2 steps

Knowledge Booster


Learn more about
Need a deep-dive on the concept behind this application? Look no further. Learn more about this topic, statistics and related others by exploring similar questions and additional content below.Recommended textbooks for you
Glencoe Algebra 1, Student Edition, 9780079039897…
Algebra
ISBN:
9780079039897
Author:
Carter
Publisher:
McGraw Hill
Glencoe Algebra 1, Student Edition, 9780079039897…
Algebra
ISBN:
9780079039897
Author:
Carter
Publisher:
McGraw Hill