Match the regression equation with the appropriate graph. (Note that the x- and y- axes are broken.) -1.72x+84.99
Q: appropriate: (a) find the critical value tα/2, (b) find the critical value zα/2, or (c) state…
A: It is given that Sample size, n = 58 Confidence level = 90%The population standard deviation σ is…
Q: From a sample of 200 bread rolls from Ideal bakery, 95 of the were wheat. The manager of the bakery…
A: i) The hypotheses for the test are given below. Null hypothesis: H0: p = 0.49 Alternative…
Q: a) Suppose that Y₁, Y₂, ..., Y₁ is a random sample from a normal distribution with parameter mean 0…
A:
Q: Do you want to own your own candy store? Wow! With some interest in running your own business and a…
A: The sample mean is 107.1 and the sample standard deviation is 30.7.
Q: 1. A survey by the National Retail Federation found that woman spend on average R146.21 on a…
A: Given,mean(μ)=146.21standard deviation(σ)=29.44
Q: a) Let 3, 1, 3, 0, 3, 2, 2, 0, 1, 2 be ten independent observations from a binomial experiment of…
A: X~Bin(n=4,β) Sample size=10
Q: The duration of flights between two locations is normally distributed with a mean of 6 hours and a…
A: GivenMean(μ)=6 hoursstandard deviation(σ)=45 minutesσ=4560=0.75 hours
Q: b) f(x; 0) = . 0, } Find the maximum likelihood estimator (MLE) of 0. elsewhere
A: It is given that the probability density function of X is f(x; θ) = { (θ + 1)•xθ, 0 < x < 1…
Q: Calculate the standard deviation and the co-efficient of variation respectively for the distribution…
A: standard deviation and the co-efficient of variation respectively for the distribution given in…
Q: Find the percentage of women who spend less than R190.00 on a Saturday lunch
A: It is given that X : women spend follows N(mean = 146.21, SD = 29.44), then Z = (X - mean)/SD…
Q: In a survey, 15 people were asked how much they spent on their child's last birthday gift. The…
A:
Q: Fill in the missing values for this ANOVA summary table: S.S. d.f. Between Within TOTAL 1267.84 7…
A: ANOVA is used to test the significance difference between more than two means. The test statistic is…
Q: A random sample of 10 night students was taken with a sample mean GPA of 3.5 and a standard…
A: given data, x¯1=3.50s1=0.07n1=10x¯2=3.48s2=0.04n1=15population with unequal variances.
Q: A manufacturer knows that their items have a normally distributed lifespan, with a mean of 14.7…
A:
Q: Statistics show that only 25% of South african taxpayers submit their tax returns before the…
A: Givenp=0.25sample size(n)=6Let "x" be the no.of adults submitted their tax returns before the…
Q: A study was conducted on students from a particular high school over the last 8 years. The following…
A: The mean is 20.4 and the standard deviation is 3.8.
Q: rom Exercise 8.72 on page 349 in the textbook. Preliminary data analyses indicate that you can…
A: Given information: The data is given below, 425 510 629 236 654 200 276 501 811 332 424 674…
Q: should managing directors statement be accepted?
A: Sample size is n= 81 and x= 6 So probability p^ = x/n = 6/81 =0.07407 x~ Binomial (n= 81,…
Q: Determine where a family would go on vacation, if the choices are Bermuda, Mexico, and Canada, based…
A: The preference for the places are given as: No. of voters 94 61 87 72 79 74 1st preference B B…
Q: success is p, determine the value of p approximate to three (3) decimal places. A. 0.084 / B. 0.400…
A: It is given that Sample size, n = 10 P( X = 3 ) = 0.215 P( X = x ) = 0.251
Q: a) Let 3, 1,3,0,3,2,2,0, 1, 2 be ten independent observations from a binomial experiment of four…
A: X~Bin(n=4,β) Sample size=10
Q: Let X₁, X2, X3, ..., Xn denote a random sample of size n from the population distributed with the…
A:
Q: Situation B You and your friends are comparing the number of times you have been to the movies in…
A: Enter the data into the SPSS as follows:
Q: The census bureau reported that the mean household income in Hayward in 2019 was $86,744 with a…
A: The following information has been provided: Let X be a random variable represents the household…
Q: fic fish types. Find a 95% confidence interval for the mean difference in wholesale price between…
A:
Q: A test was conducted on the improvement of students before and after having remedial classes. Test…
A: a. Hypotheses: H0 : μd=0Ha : μd≠0 The null hypothesis states that there is no difference in test…
Q: a) measures of central tendencies (mean, median and mode); b) measures of dispersion (standard…
A: Given data: Age (x) Frequency (f) 12 6 13 62 14 194 15 343 16 492 17 548 18 83
Q: Mike's Stables has two different possible cost drivers (trainer hours and number of horses) for…
A: Given The output is as follows: Trainer's hours: Regression statistics R square 0.56…
Q: Just B please
A: In each hypothesis test, the chance of error of two types. They are type 1 and type 2 error. Type 1…
Q: Let X1, X2, X3, Xn denote a random sample of size n from the population distributed with the…
A:
Q: less than 0.62 at the a-.10 level of significance. x e following X + tleby.com/questions-a... Q✰ □:…
A:
Q: You believe the population of difference scores is normally distributed, but you do not know the…
A:
Q: Name two limitations of this test.
A: Chi Square Test The Chi-square test is a non-parametric type that does not have distribution and is…
Q: If n = 27, x = 48, and s= 14, construct a confidence interval at a 99% confidence level. Assume the…
A: Given n=27, sample mean x̄=48, s=14
Q: 1. A. 0.084 B. 0.400 C. 0.854 D. 0.454 2. Using the information given in question one (1) and the…
A: It is given that Sample size, n = 10 P( X = 3 ) = 0.215 P( X = 4 ) = 0.251
Q: The accompanying data table lists the magnitudes of 50 earthquakes measured on the Richter scale.…
A: First we state the hypothesis for the above claim. H0: the population of earthquakes do not have a…
Q: Let x = (x₁,...,xn) be a data set, and denote its sample standard deviation with sx. Let y₁ = ax; +…
A:
Q: Calculate the approximate price relatives to two decimal places for the MTN and Vodacom stocks over…
A: Consider the following table: Stock Price p0 Qty q0 Price p1 Qty q1 p0q0 p0q1 p1q0…
Q: A South African manufacturer of BMW cars offers a model in one of three colors: Blue, Red, or Black.…
A: Given information: There are 3 colors: Blue, Red and Black. P(Blue)=1/3 Claim: Test whether or not…
Q: You intend to estimate a population mean with a confidence interval. You believe the population to…
A: given data 99% ci for μn = 21 find ctitical t value.
Q: Let X₁, X₂,..., X and Y₁, Y2...., Ym be random samples from populations with moment generating 25…
A: Solution: From the given information, the moment generating functions of X and Y are
Q: Let X₁, X2, X3,..., Xn denote a random sample of size n from the population distributed with the…
A:
Q: modified as follows: In a random sample of 55 panels, the average failure time is 2.07 years and the…
A: Given: n = 55 X = 2.07 s = 1.11 Confidence level = 91.7% Formula Used: Confidence interval = X ± tsn
Q: A1, A2, A3,..., An Xi and Y = -√n. a random sample of size n fr population Suppose i) Show that the…
A: It is given that X follows N(θ, 1), then E(X) = θ and V(X) = 1, And the moment genarating function…
Q: o Show that the expected value and variance of a one-period yield function for geometric Brownian…
A: Given the statement that the expected value and variance of a one-period yield function for…
Q: pose a scheduled airline flight must average at least 65% occupancy in order to be profitable to the…
A: The scheduled airline flight must average at least 65%.
Q: 4. The random vector x = (x1, x2, x3) has multivariate distribution (1) 2 9)). 3 Find the…
A: Given that, The random vector x=(x1, x2, x3) TThas multivariate distribution Then we have to find…
Q: Let X₁, X₂, X3,..., Xn be a random sample of size n from population X. Suppose that X~N(0, 1) Σ1Xi…
A: From the given information, Moment of generating function of normal distribution is eμt+σ22t2. For…
Q: An estimate of the mean time taken by this group of workers is: A. 51.7 min B. 47.0 min C. 49.7 min…
A: First we convert histogram into frequency table, class frequency(f) 10-20 0 20-30 2 30-40…
Q: I need help with part 2 please. Thank you Bob Downe is auditing Red Cedar Office Furniture (RCOF),…
A: SOLUTION :- Given that , The Book value of population tested is (BV) = $6719028.95 The Tolearble…
Please explain how you determinded which graph is correct.
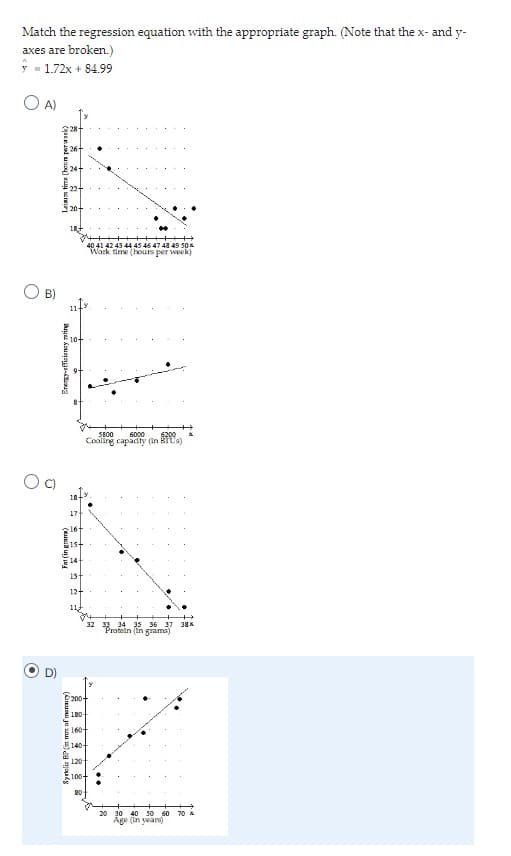
Trending now
This is a popular solution!
Step by step
Solved in 2 steps
- Olympic Pole Vault The graph in Figure 7 indicates that in recent years the winning Olympic men’s pole vault height has fallen below the value predicted by the regression line in Example 2. This might have occurred because when the pole vault was a new event there was much room for improvement in vaulters’ performances, whereas now even the best training can produce only incremental advances. Let’s see whether concentrating on more recent results gives a better predictor of future records. (a) Use the data in Table 2 (page 176) to complete the table of winning pole vault heights shown in the margin. (Note that we are using x=0 to correspond to the year 1972, where this restricted data set begins.) (b) Find the regression line for the data in part ‚(a). (c) Plot the data and the regression line on the same axes. Does the regression line seem to provide a good model for the data? (d) What does the regression line predict as the winning pole vault height for the 2012 Olympics? Compare this predicted value to the actual 2012 winning height of 5.97 m, as described on page 177. Has this new regression line provided a better prediction than the line in Example 2?The following fictitious table shows kryptonite price, in dollar per gram, t years after 2006. t= Years since 2006 0 1 2 3 4 5 6 7 8 9 10 K= Price 56 51 50 55 58 52 45 43 44 48 51 Make a quartic model of these data. Round the regression parameters to two decimal places.Cellular Phone Subscribers The table shows the numbers of cellular phone subscribers y in millions in the United States from 2008 through 2013. Source: CTIA- The Wireless Association Year200820092010201120122013Number,y270286296316326336 (a) Find the least squares regression line for the data. Let x represent the year, with x=8 corresponding to 2008. (b) Use the linear regression capabilities of a graphing utility to find a linear model for the data. How does this model compare with the model obtained in part a? (c) Use the linear model to create a table of estimated values for y. Compare the estimated values with the actual data.
- Life Expectancy The following table shows the average life expectancy, in years, of a child born in the given year42 Life expectancy 2005 77.6 2007 78.1 2009 78.5 2011 78.7 2013 78.8 a. Find the equation of the regression line, and explain the meaning of its slope. b. Plot the data points and the regression line. c. Explain in practical terms the meaning of the slope of the regression line. d. Based on the trend of the regression line, what do you predict as the life expectancy of a child born in 2019? e. Based on the trend of the regression line, what do you predict as the life expectancy of a child born in 1580?2300According to the summary result of linear regression model between A and B obtained from R given below, we can fit a regression line. Assume thatA has any value. If we decrease the value of A by 3, how would Y be affected?a) 58.8945 decreaseb) 58.8945 increasec) 29.8827 increased) 49.5142 decreasee) 29.8827 decreaseThe prelim grades (x) and midterm grades (y) of a sample of 10 MMW students is modeled by the regression line y = 12.0623 + 0.7771x. Estimate the prelim grade if the midterm grade is 83.